Data Application User Guide
The Data Application can be used to:
- Create tagging rules to enrich or classify the data.
- Configure the display of the data, using the available dimensions and data columns.
- Search and query the data using filters to slice-and-dice data.
- Drill-through to display related detail.
- Drill-down to display the underlying data lines e.g. invoice or PO lines.
- Download data reports.
- Save and share reports with other users.
Dimensions
Dimensions are data points that can be grouped together e.g. Chart of Accounts or Suppliers. Across all invoices, some values will be repeated. Dimensions group the lines of spend to show the aggregated number of invoices, suppliers, and spend.
In the Rosslyn Platform, there are two types of dimensions:
Flat Dimensions
Flat dimensions have a single set of values e.g. Company, Cost Centre, Supplier or Material Group,.
Hierarchical Dimensions
Hierarchical dimensions have multiple levels such as a category structure with up to 4-6 levels within a tree e.g. Category, Organisation or Geographical Hierarchy
Each hierarchy can hold up to 999 values per level.
The data report dynamically adjusts, depending on the dimensions selections. If using a single dimension, the report will show the values as aggregated totals. As more dimensions are added, the report will split the totals e.g. by Supplier and Cost Centre.
If the Invoice Detail option is selected, the report will expand to show the individual line items.
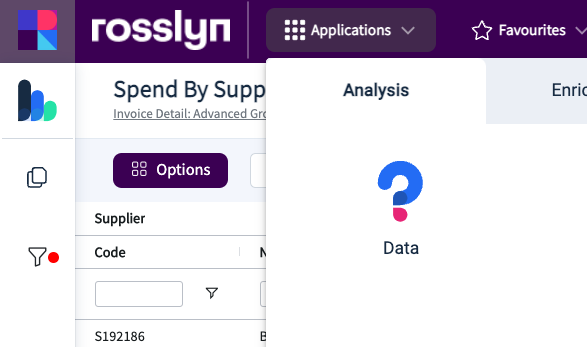
Accessing the Data Application
Option 1: Applications Menu: Open the menu, located at the top of the screen and select the Data icon. If your default report is a data report, this view will be displayed. If the default report is a dashboard, then this report will open using your company's default target dimension e.g. category, which can be seen in the Options section of the Data Application.
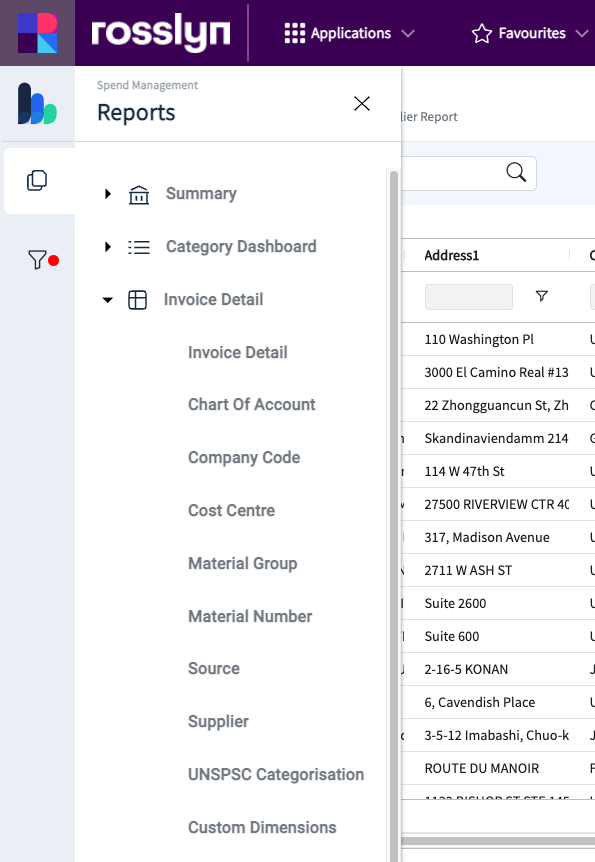
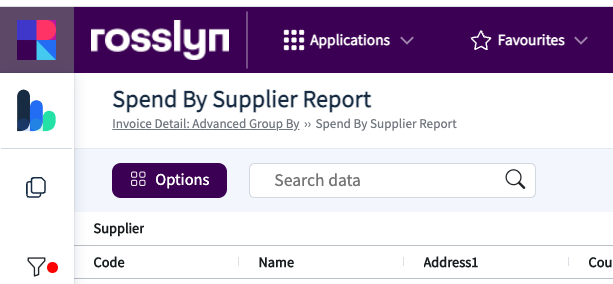
Option 2: Navigation Menu: In the navigation menu on the left side of the screen, the Data Application can be accessed by opening the Invoice Detail section and using one of the pre-defined views. These views were set up during your onboarding stage and can be re-configured if required by Rosslyn.
Note: The Data Application can be configured if required. See subsequent sections covering configuration and filtering options.
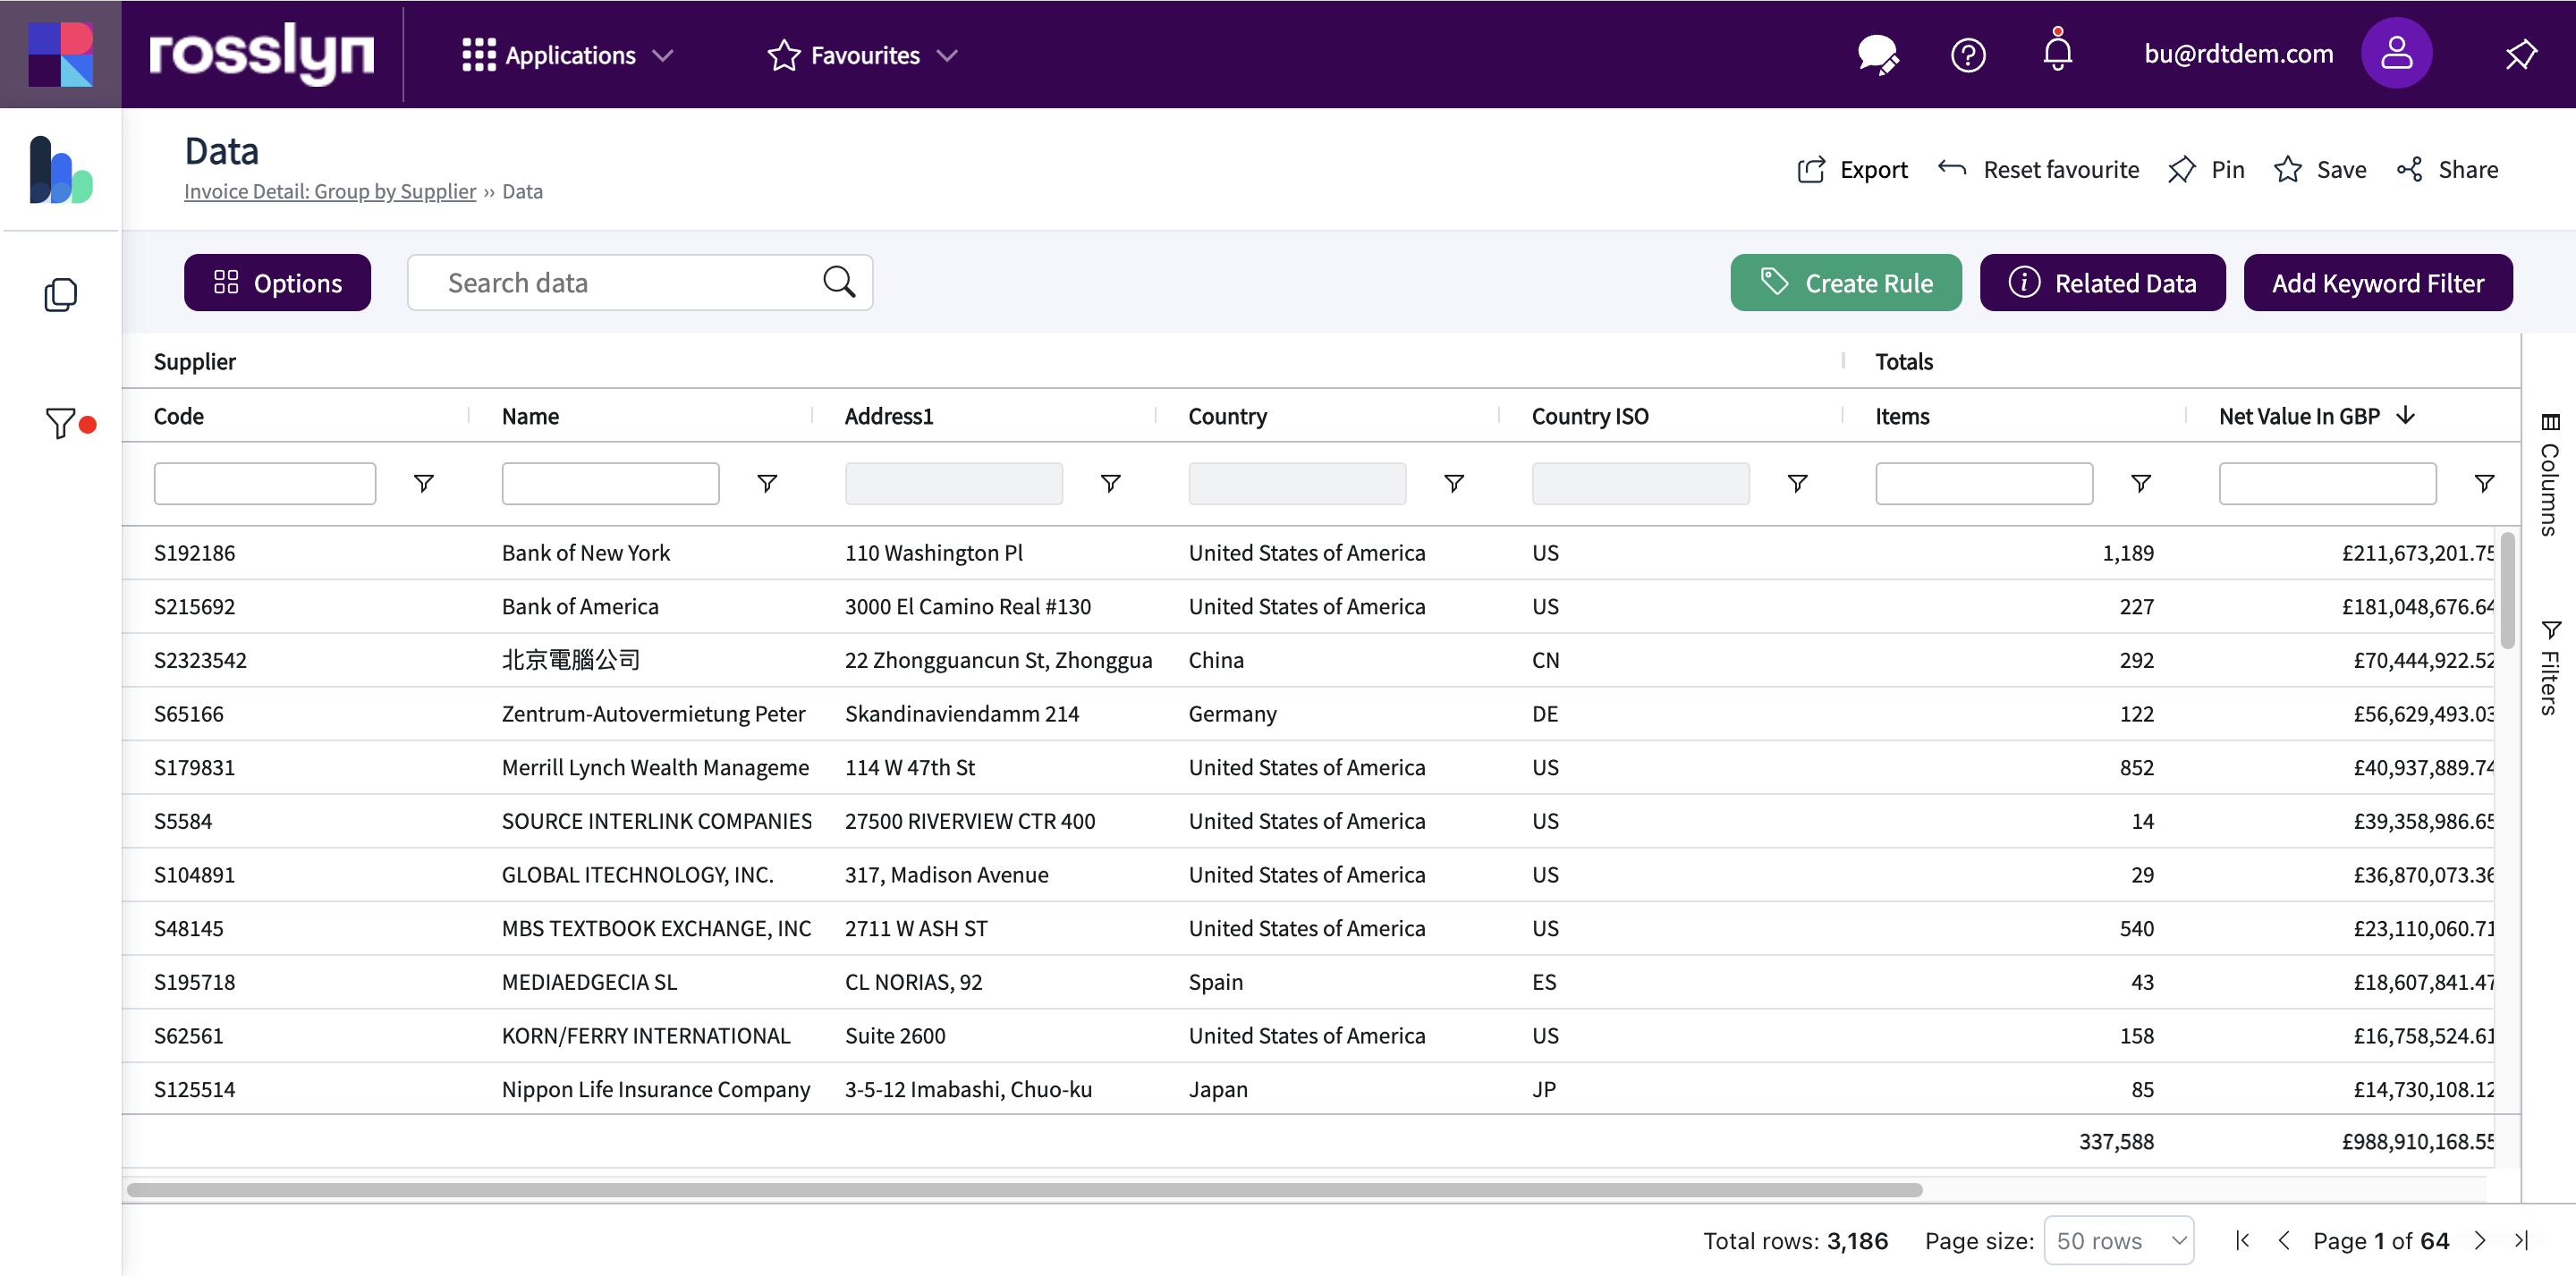
Options
To update the options, click the 'Options' button, located in the Data Application.
In this menu, there is a range of options for selection.
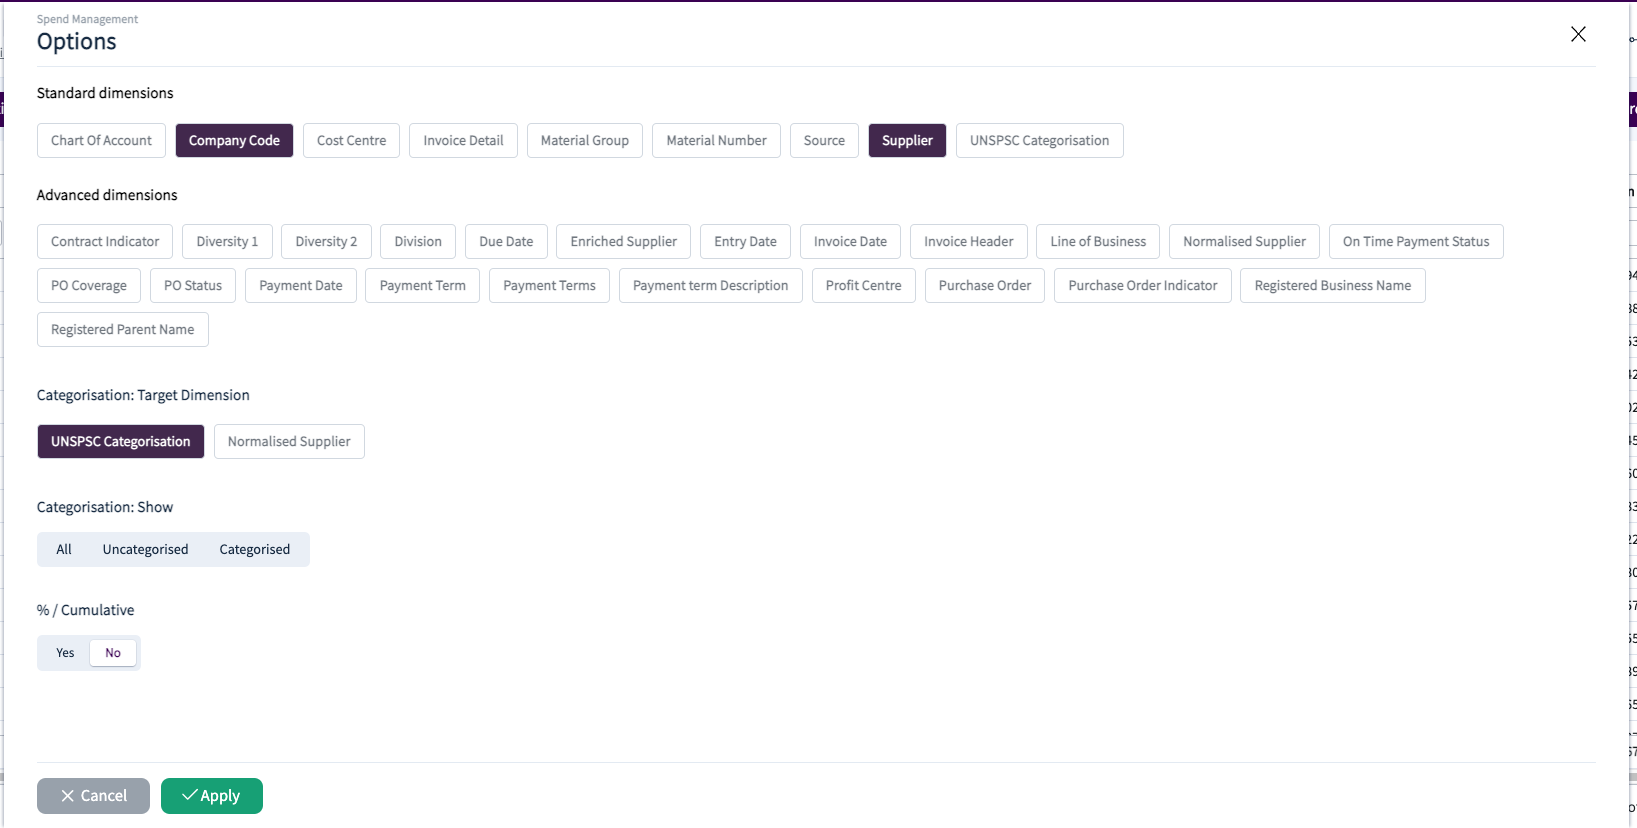
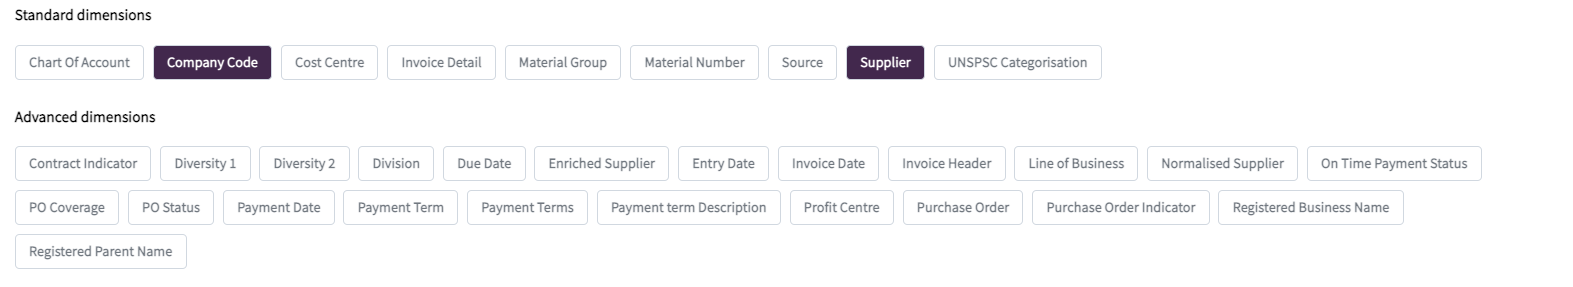
You can select from standard or advanced dimensions. These groups were agreed upon during the onboarding stage, where the dimensions were grouped into frequent (Standard) and less frequently used (Advanced) dimensions.
There are three other options on this screen.
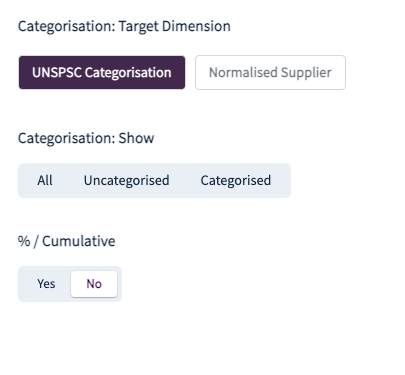
The target dimension option allows you to select a dimension to create rules for e.g. when tagging suppliers to a category, the category dimension would need to be selected here. When a rule is created, the options for that target dimension will be presented.
The Categorisation option allows the report to be filtered if required to show All data, the Categorised or the Uncategorised data.
The Cumulative option will add a percentage value to the data report.
Click 'Apply' to run the report.

Note: You can return to the ‘Options' menu at any time to change the selections
Filtering
A range of filtering tools are available in the Data Application, which allows you to filter reports to find, refine and isolate the required data.
These tools are:
Column and right-side filters
Left and right side filters
Keyword clustering filters
Column filters
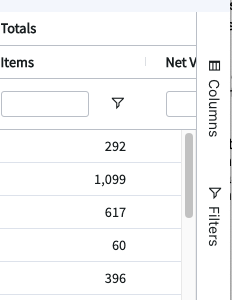
Use column filters to filter each column individually; for example, select the column filter option above the ‘Country’ column header using the Filter icon.
Use the dropdown list to search and select a value.
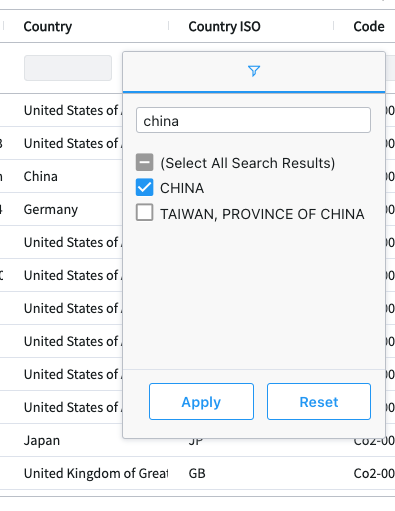
Select ‘Apply’ to display data relating to the selections.
Additional ‘Column Filters’ can be applied to further refine the data.
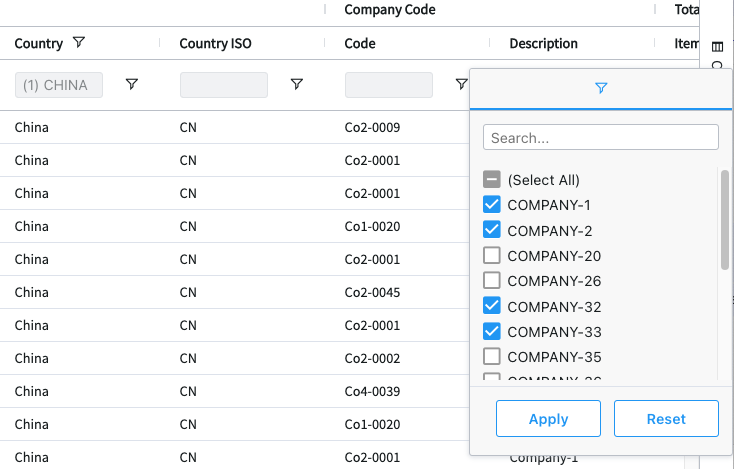
To clear an individual ‘Column Filter’, select the Column Filter icon and select the ‘Reset’ option:
Left-side filters
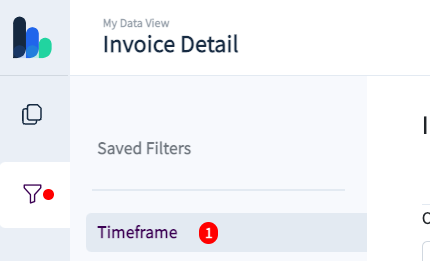
Filters can be accessed via the Filter icon situated at the left of the screen.
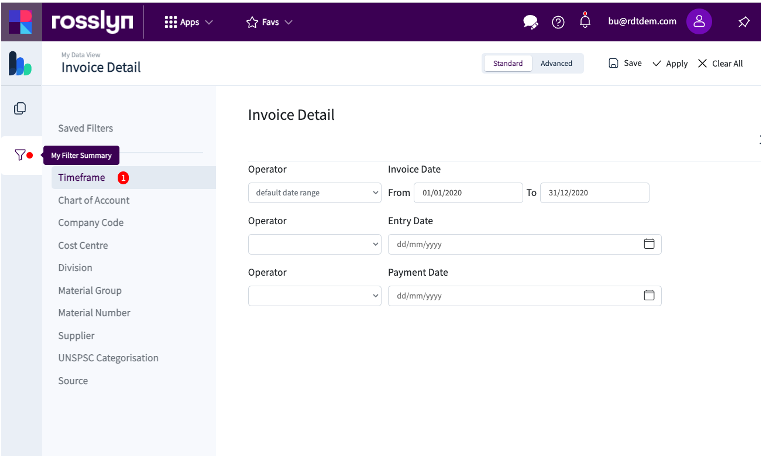
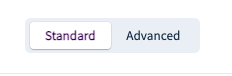
There are two Filtering modes: ‘Standard’ and ‘Advanced’. Use the toggle option to change the view.
Using the Standard mode you can view ‘Saved Filters’.
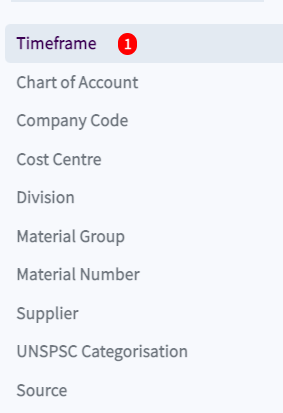
You can select types from other filter options such as ‘Timeframe’, Categorisation’ and ‘Supplier’. The list shows your Standard dimensions.
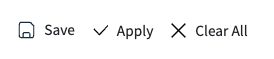
Further options are available in the Filtering window, which includes, ‘Save’, ‘Apply’, ‘Clear All’ and ‘Clear All’.
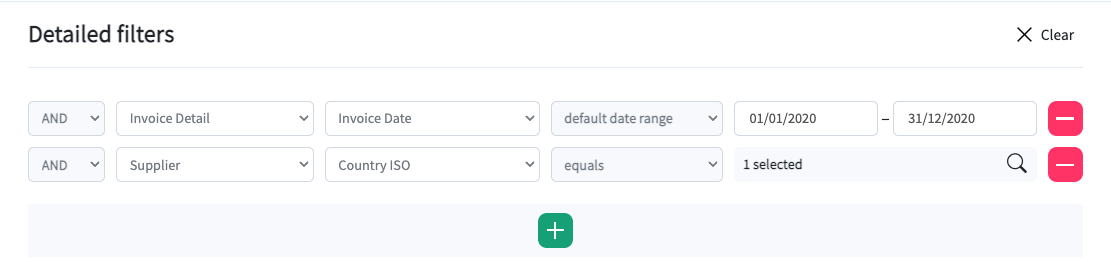
In ‘Advanced’ mode you can select a range of detailed filters and apply these to the data report.
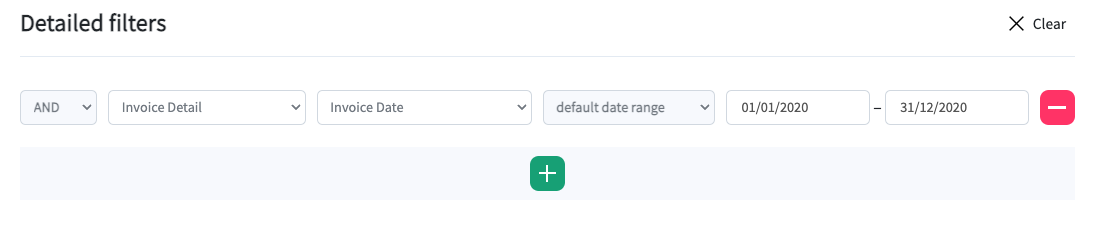
Use the '+' to add further lines or the ' - ' to remove a line.
Each filter line must contain a ‘boolean operator’ e.g AND, OR or NOT, and a dimension. For some dimensions, you can select from a list of related columns such as supplier address fields. The filter option will dynamically change depending on the selected Dimension. Select the ‘Apply’ button at the top of the screen to run the report.
Boolean Operators
AND To be included within the scope of the preceding filter line.
OR This filter line is used as an alternative to the preceding filter line.
NOT This filter line should be used to exclude data from the preceding filter line.
When applying multiple filter lines, check you are using a logical sequence. Only filter by options and columns of data currently available in the data report.
Columns and Filters
A data report can be adjusted and filtered to suit your requirements using the ‘Columns’ and ‘Filters’ options found at the right edge of the screen report
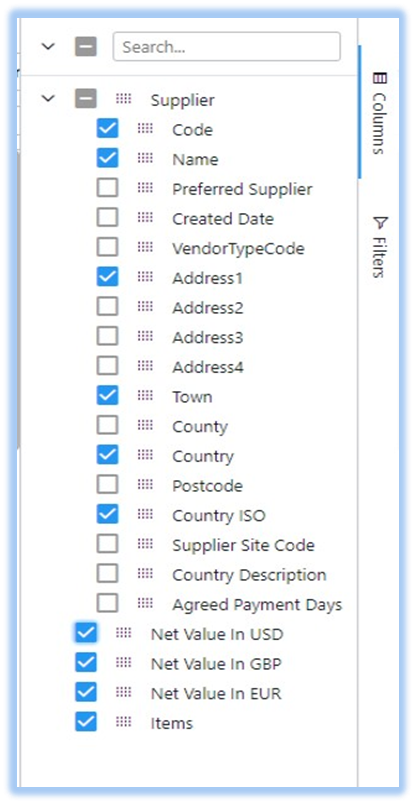
Selecting the ‘Columns’ option allows you to select the required columns for display in the data reports, for example:
Selecting the ‘Filters’ option allows you to filter a chosen dimension in the data report. In this example, we can see the Supplier dimension. There is a filter icon next to the country to show there is an active filter in use for this column.
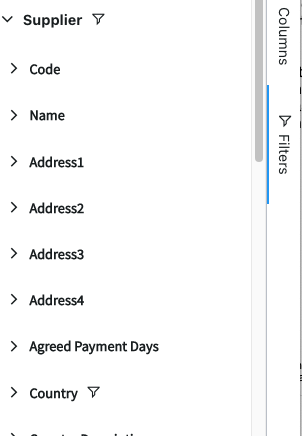
Selecting the required dimension will open further filtering options for you to select.
Keyword Clustering Filters
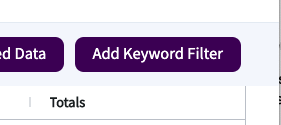
The ‘Add Keyword Filter’ option can be used as an advanced filtering tool to display the counts and values of words in the data. Words can be chosen from the displayed list and data reports filtered by those words.
Select the ‘Add Keyword Filter’ button, located in the top right of the data report:
This opens the window below:
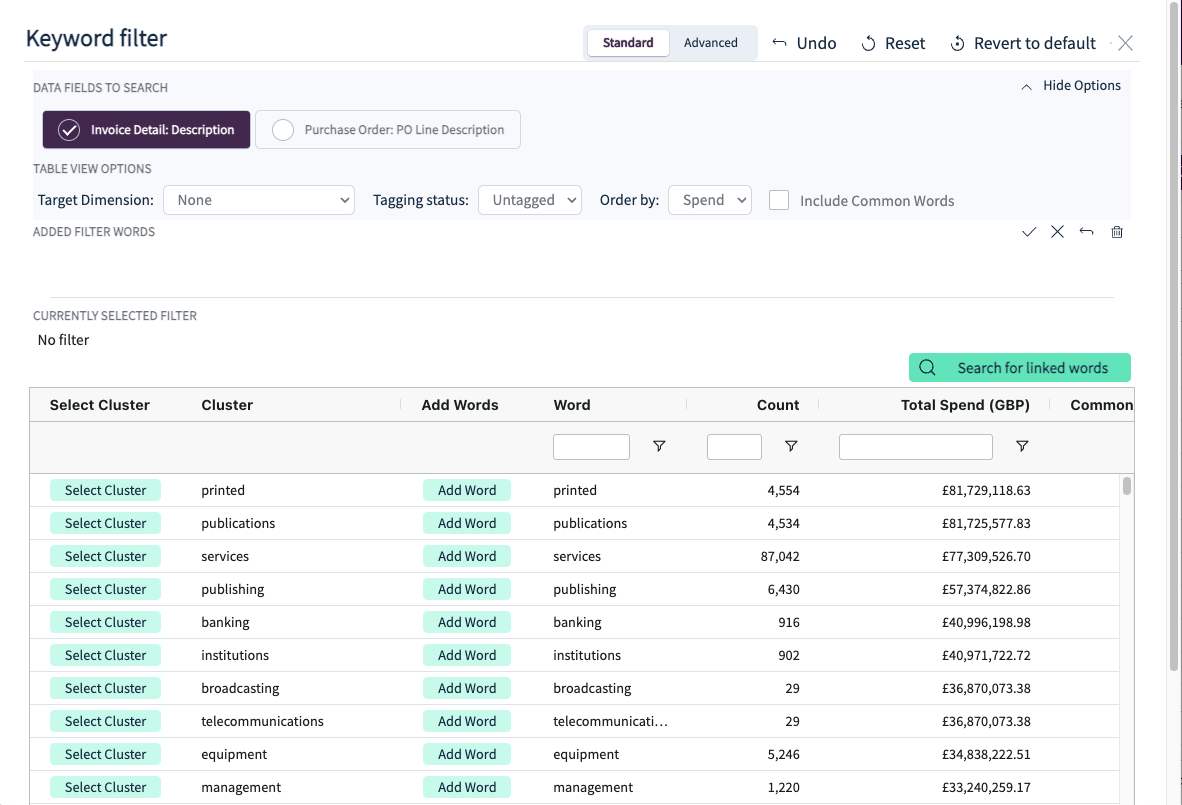
At the top of this window, you can select the data fields to search using the toggle.
The ‘Table view options’, in either ‘Standard’ or Advanced’ modes:
In this example, the word ‘printed’ has been selected from the list. Clicking on the 'Update linked words' button will display the related words.
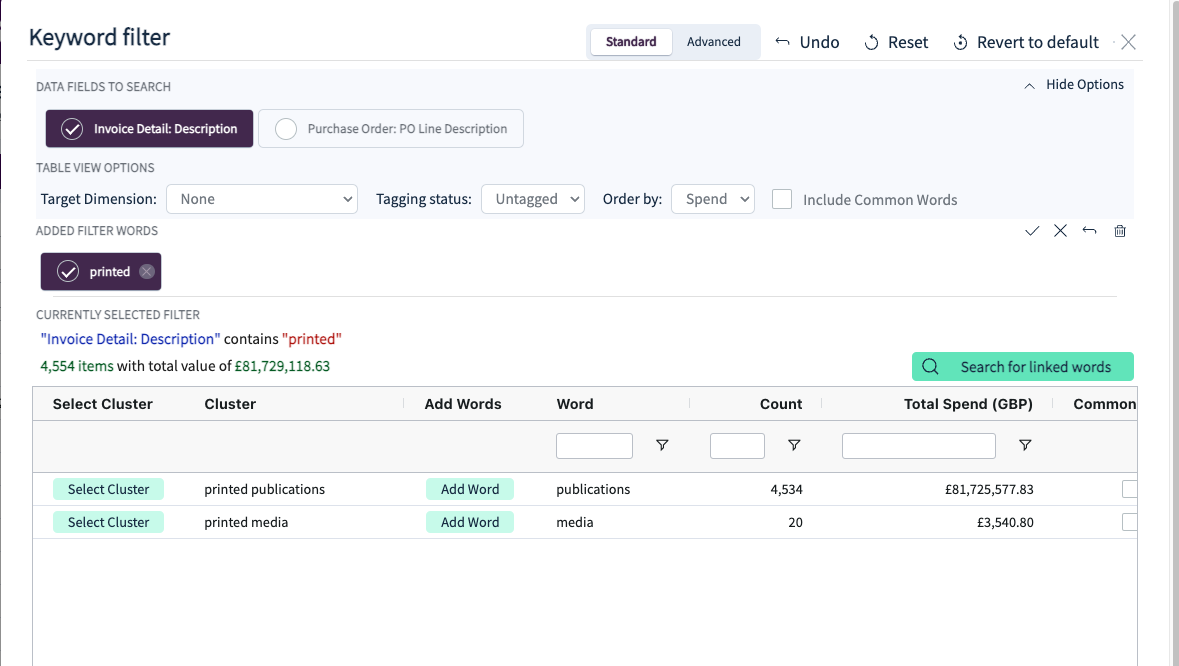
At the bottom of the ‘Word cluster filter’ window are the action choices:
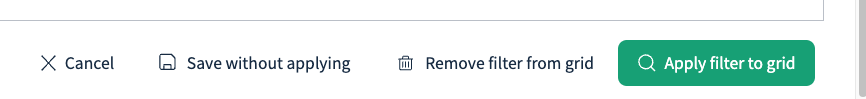
Clicking on this button will close this screen and refresh the data report using the selected filters.
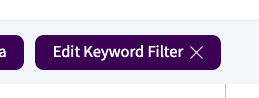
To return to the ‘Word clustering filter’ window, select the Edit Keyword Filter.
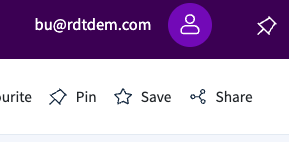
Saving
Data reports can be saved using the ‘Save’ option, located at the top right of the screen.
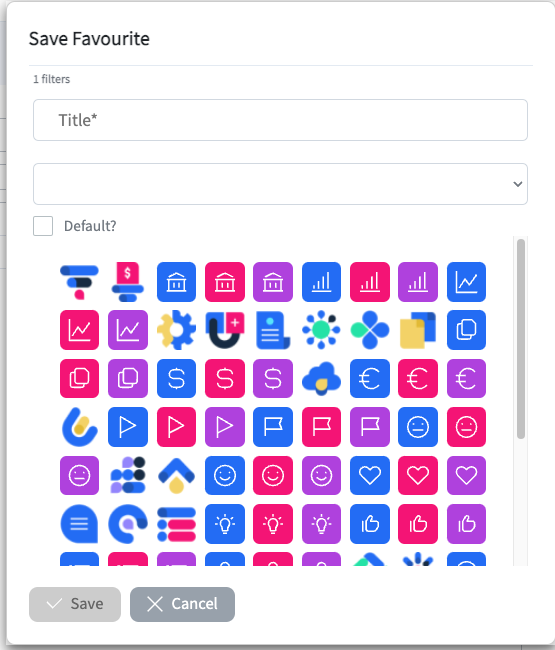
Click Save to open the ‘Save favourite’ window
Note: A Save As option will appear if you are saving a previously saved report.
1. Give the report a title
2. Select a folder for storage within the manage favourites screen (optional)
3. Check ‘Default’ to make this your default report
4. Choose and select an icon
5. Select ‘Save’
To view a saved report, select Favourites to open the list of saved views.

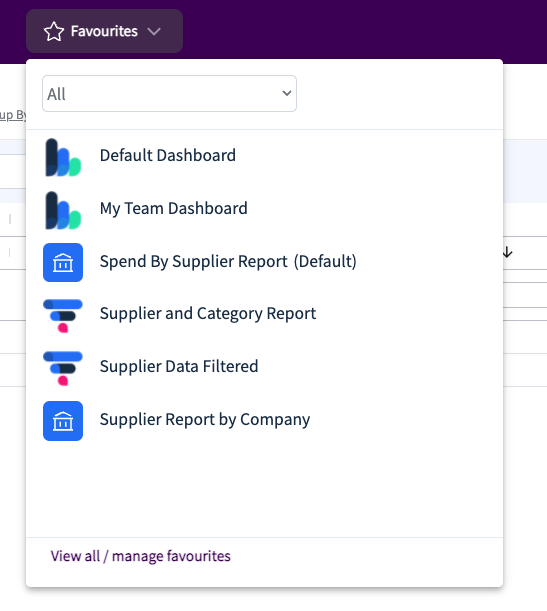
Select the required report from the list to open the report.
Sharing
Data reports can be shared with other Rosslyn users.
To share a report, select 'Share', located at the top right side of the screen.
This will open the ‘Share favourite’ window:
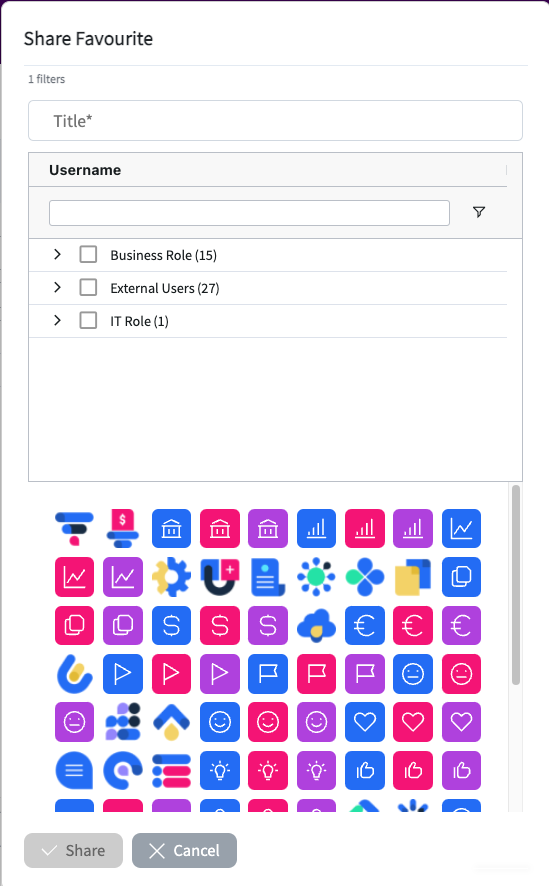
1. Give the report a title
2. Select the roles or users to share the report with.
3. Check ‘Default’ to make this your default report
4. Choose and select an icon
5. Select ‘Share’
Shared reports will appear in both the recipient's and your own favourites menu.
Exporting
Data reports can be exported from the Rosslyn Platform as CSV files.
Note: The total number of rows that can be exported in a single request is 500,000. The total rows count is displayed at the bottom of the report.
Once you have configured your report and checked its content size, select ‘Export’ at the top right of the report screen:
Open the download to view, edit or save as required
Pin report columns
Columns can be pinned within a report. Pinned columns will make the selected columns remain static whilst the rest of the columns can be scrolled horizontally. Columns can be pinned to the left or right of the screen.
Hover over the ‘column header’ of the selected column to reveal the pinning option.
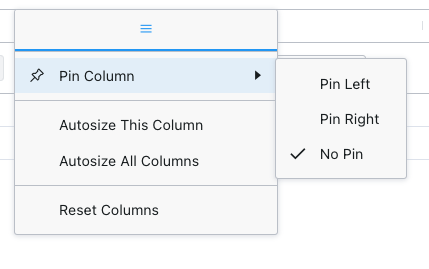
Click the three lines to display the options below.
Producing a chart
Charts can be created from a data report. There are a range of chart types available.
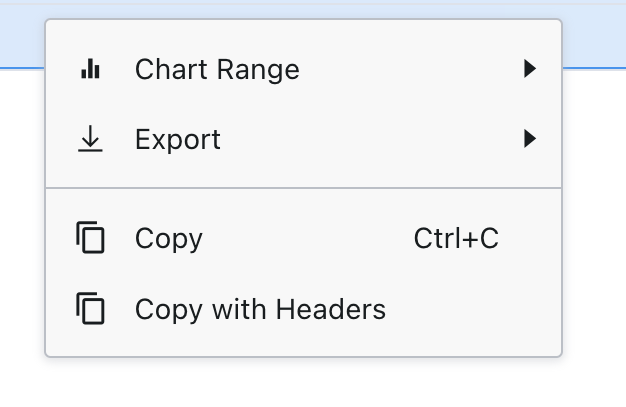
Use the mouse to click select the required range of data to be included in the chart
Right-click over the selected area to display the menu below and select ‘Chart Range’
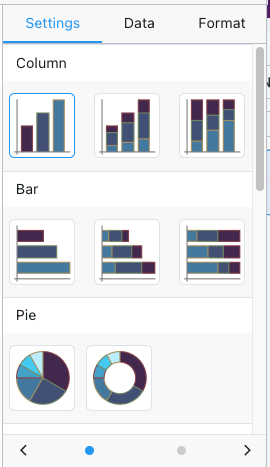
The range of chart types are:
1. Column
2. Bar
3. Pie
4. Line
5. Y X (Scatter)
6. Area
7. Histogram
8. Combination
Select the type of chart and the chart will overlay the report screen.
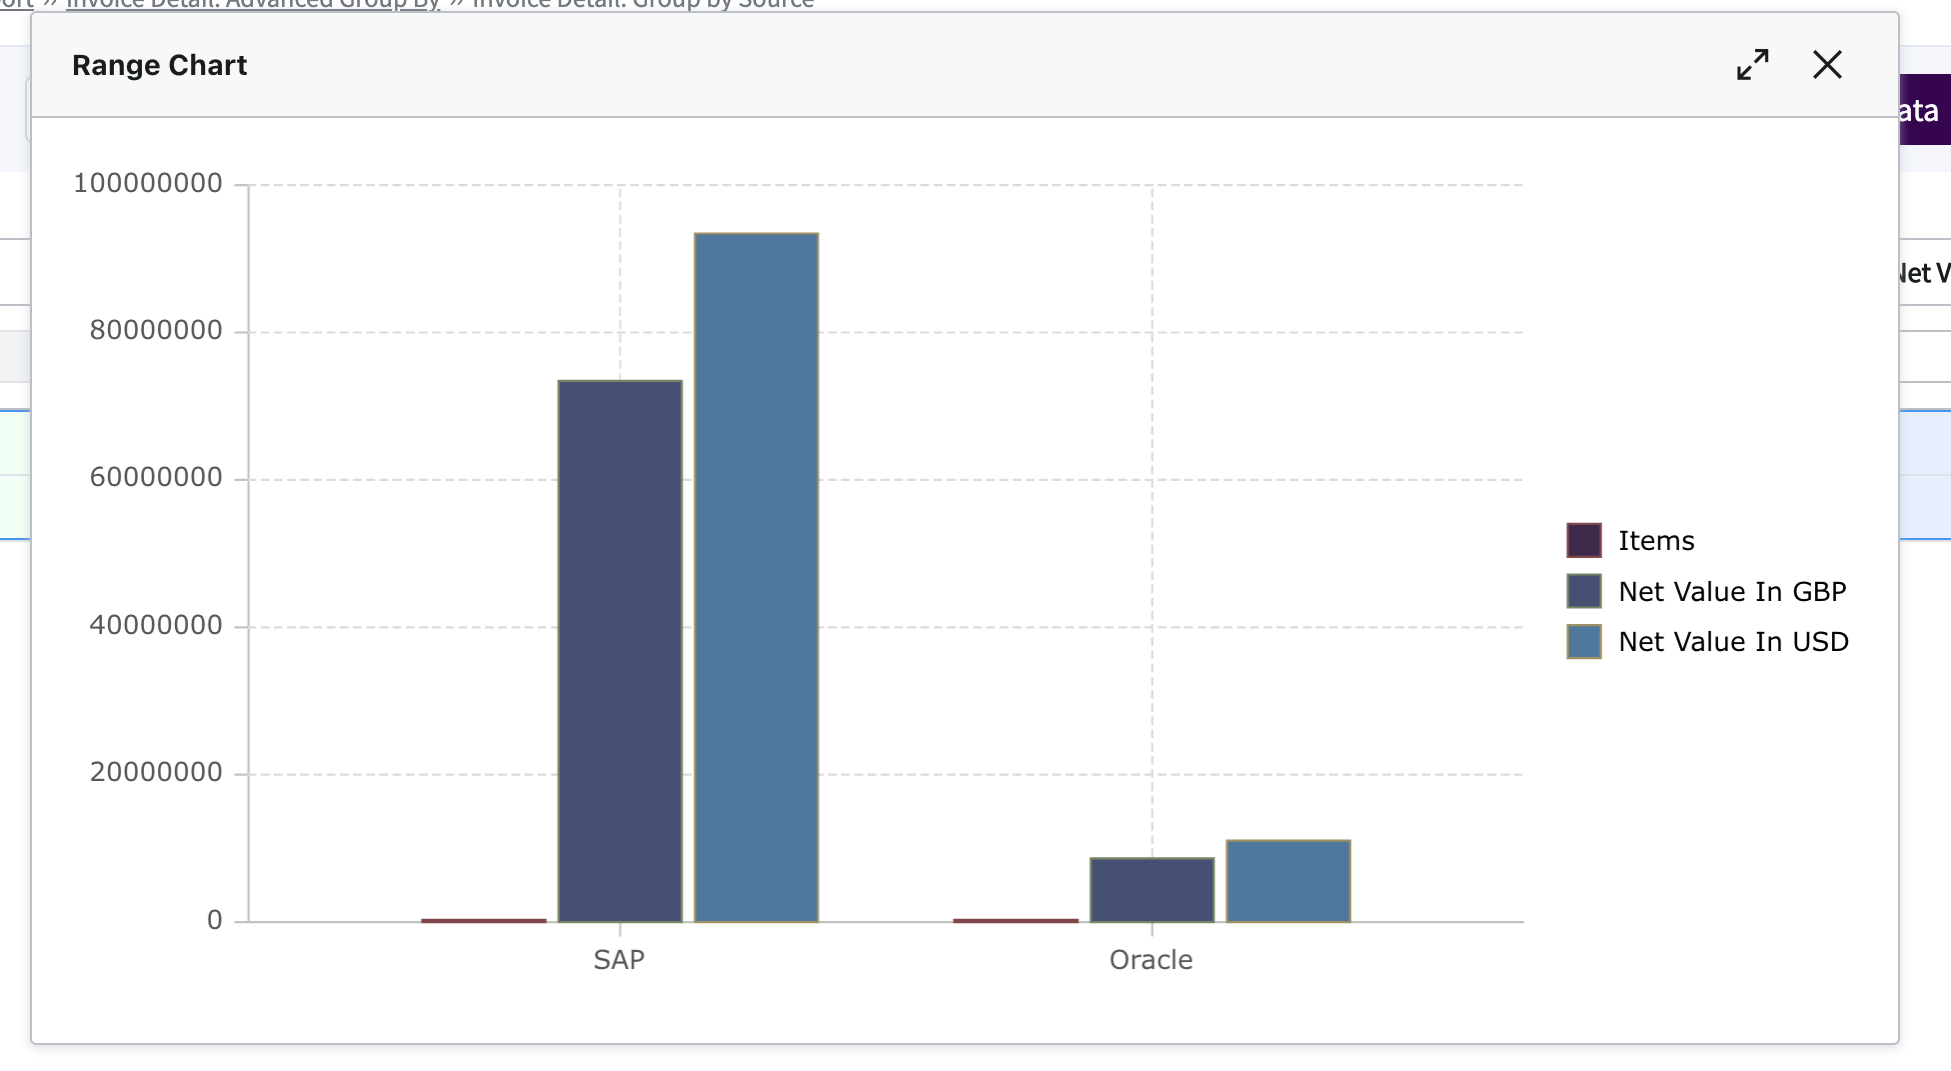
Hover over the chart to display the further action menu in the top right of the chart.
1. Menu
2. Link/unlink to the grid.
3. Download the chart (to download the chart in .png format)
Categorising (creating a rule / assigning a tag) to a taggable dimension