Tail Spend Analysis User Guide
Tail Spend typically goes unmanaged within an organisation and may have an impact on the financial performance due to its impact.
Tail Spend typically contains 20% of the spend total across a large number of suppliers.
Tail Spend can hide maverick purchasing, waste and even fraud, which is why many organisations are starting to realise the benefits of tackling it through careful management and analysis.
Tail Spend is also called the long tail, or low-value spend. This 20% tends to be spread across multiple spend categories and via a large number of low-value transactions with numerous suppliers, many of which are used very infrequently. In fact, Tail Spend often accounts for 80% of all an organisation’s suppliers.
Tail Spend is usually unclassified, and therefore ‘invisible’ because the purchases are too small, or too infrequent to go through an organisation’s procurement system. This makes Tail Spend hard to manage. While the value of Tail Spend will vary depending on the size of an organisation, that invisible 20% often contains a few ‘maverick’ high-cost purchases that should have gone through a more strategic purchasing process, or even in some cases, procurement fraud.
The effective management and analysis of Tail Spend can achieve:
1. Cost reduction between 5% and 20%
2. Increase in process efficiency of over 10%
3. Reduced risk across the supply chain
4. Increase in the amount of strategically managed spend from an average 80% to over 90%
5. Increased usage of, and compliance with, procurement systems/processes
6. Increased visibility across the procurement process
7. Improved and effective contract and supplier management of all suppliers
Analysing Tail Spend
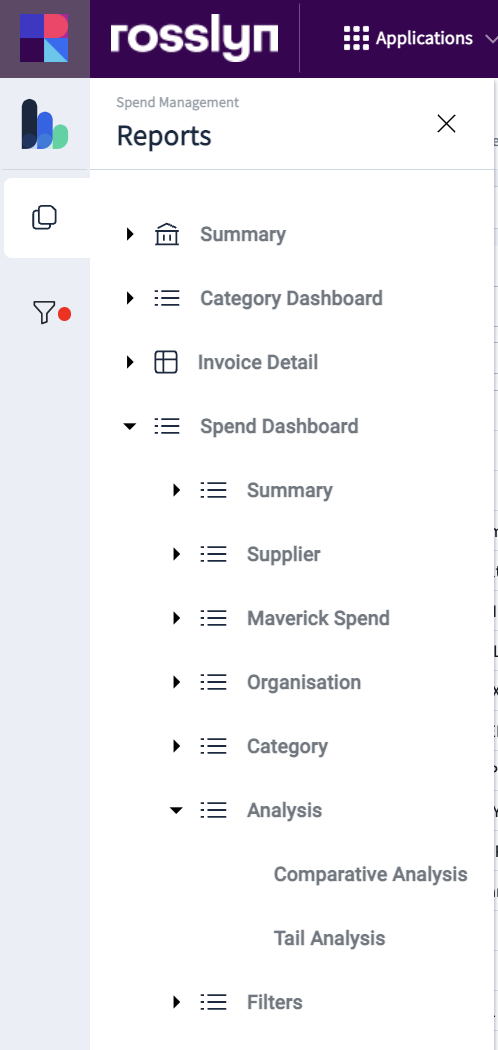
Navigate to ‘Spend Dashboard: Analysis – Tail Analysis’
The Tail Analysis sheet will display on the screen. By default, the adjustable analysis Pareto scale will be set at 80%.
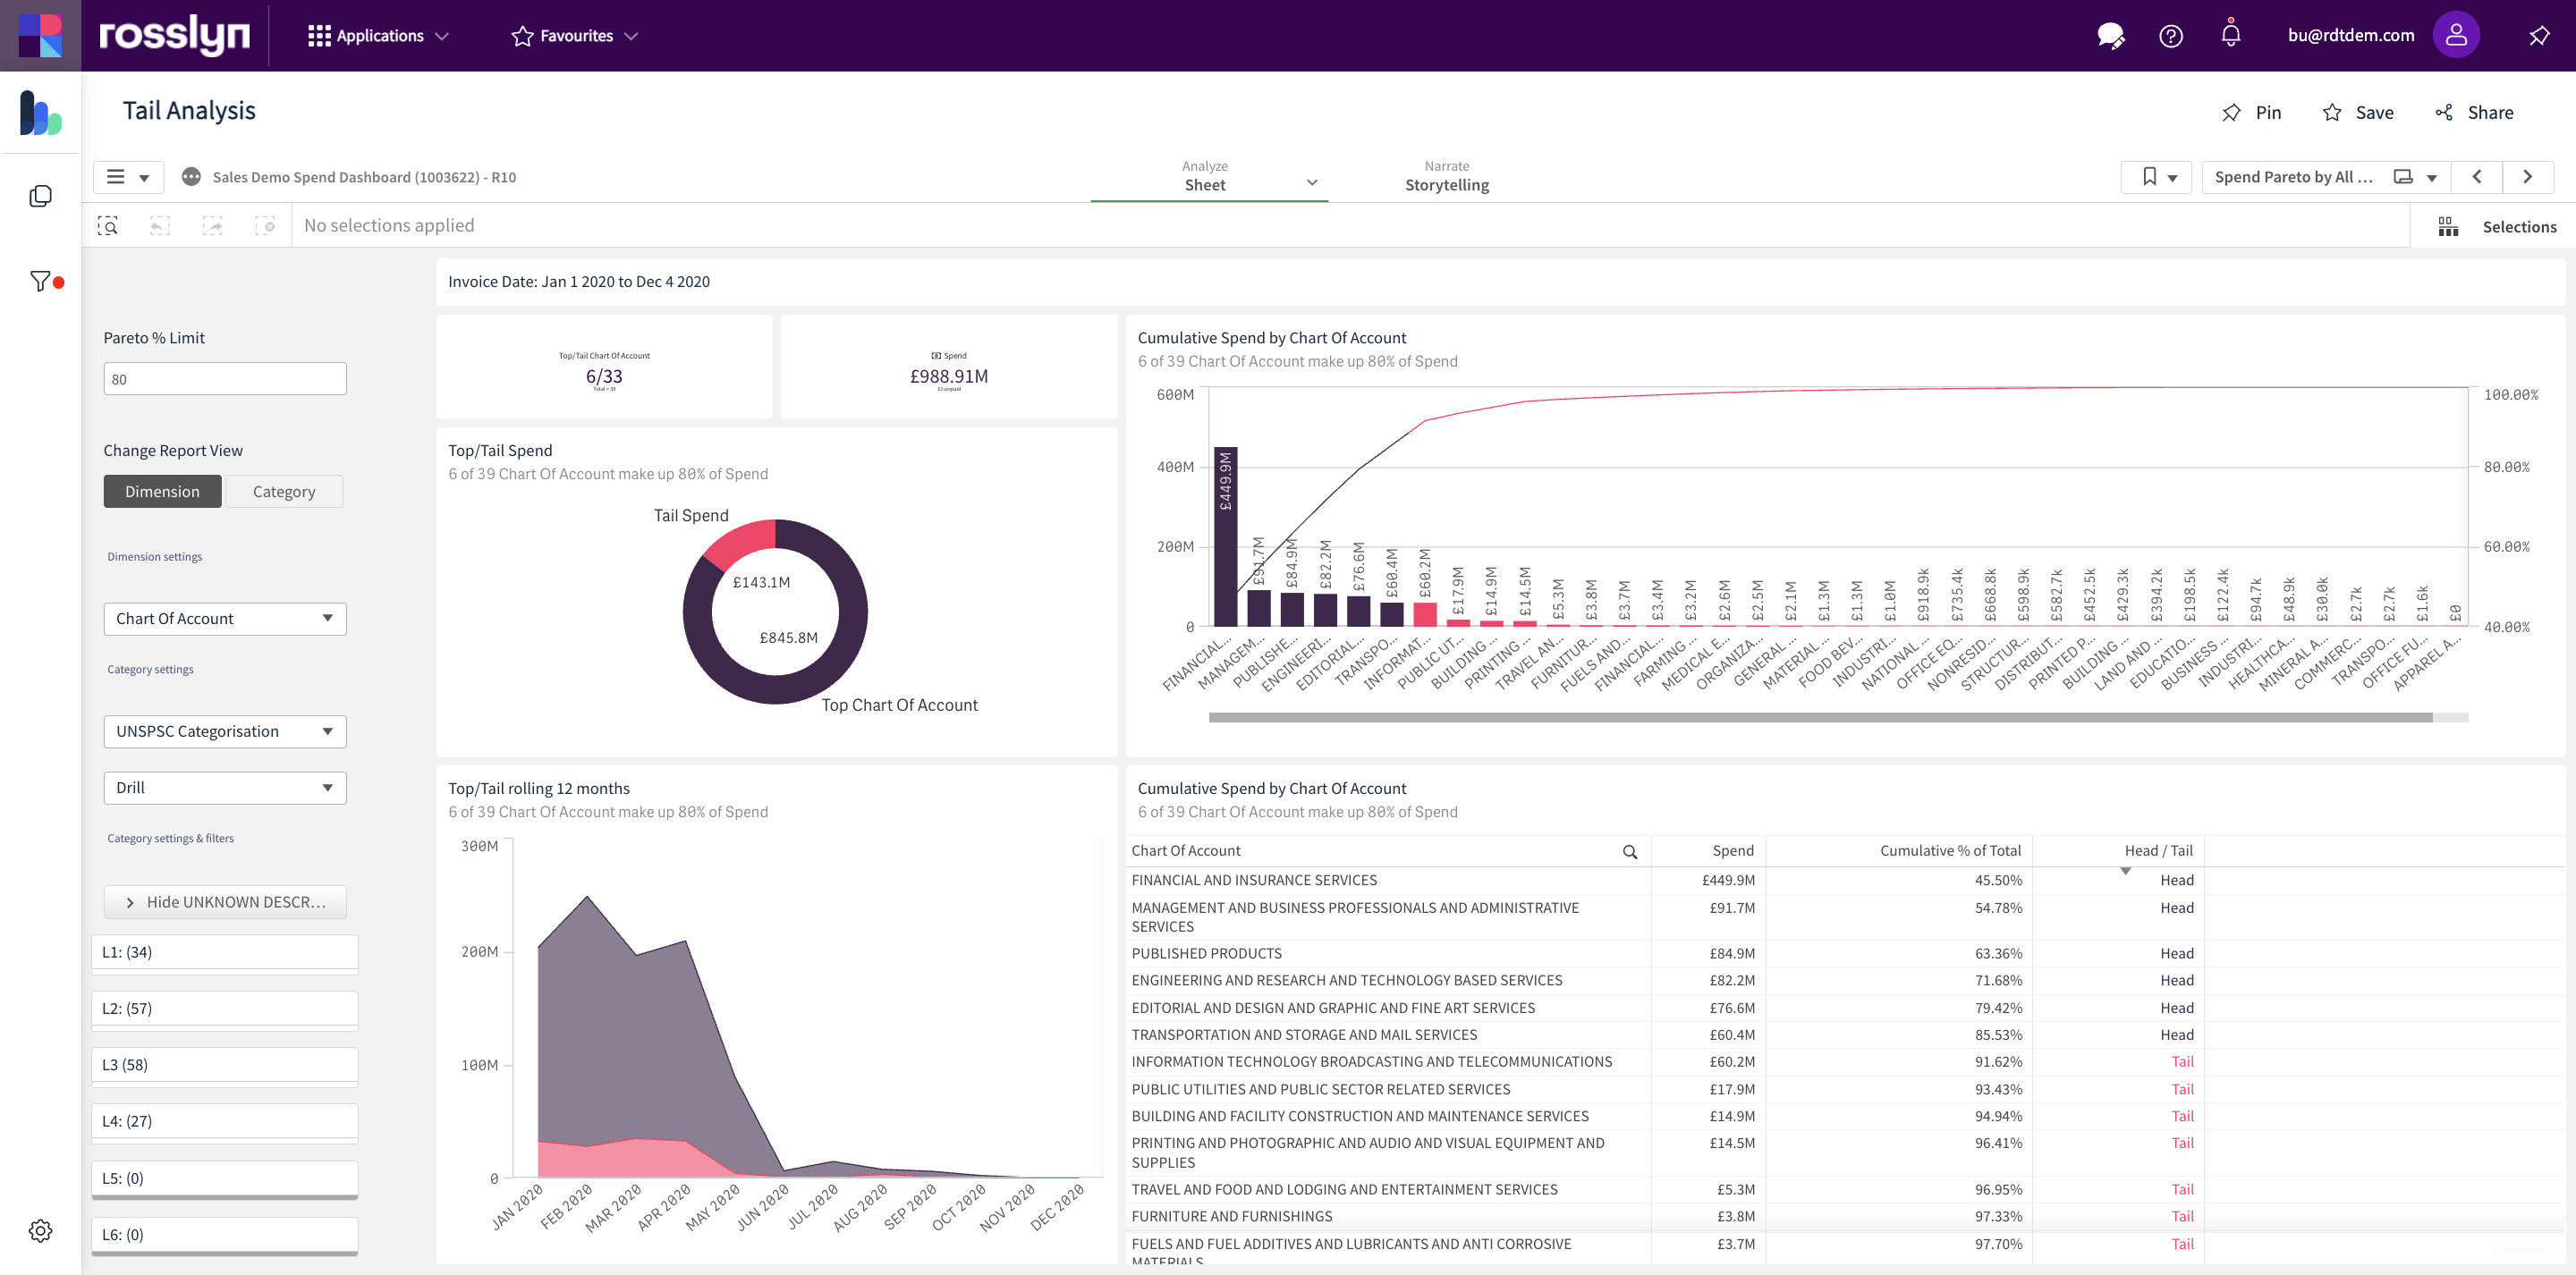
The ‘Tail Analysis’ screen consists of:
1. Analysis tools window (to the left side of the screen)
2. Dimension & Tail Spend doughnut chart
3. Dimension & Tail Spend Over Time chart
4. Dimension that cumulates % of Spend chart
5. Dimension that cumulates % of Spend table
Note: Charts and tables on this screen can be filtered.
Analysis Tools
The ‘Analysis Tools’ window contains a range of adjustable options. Charts and tables in the report widgets will update when adjusted.
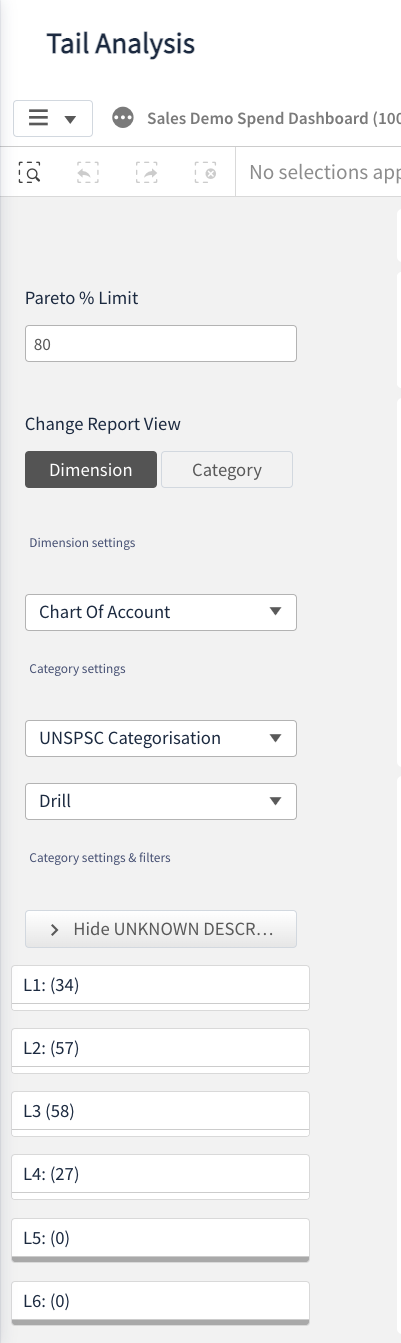
- Pareto % Limit – Adjust from 0% to 100%.
- Change Report View – Toggle between Dimension view and Category view in screen reports
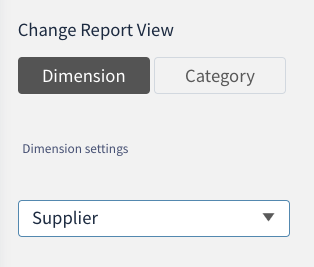
- Dimension Settings – Select the required Dimension from the dropdown list
- Category Settings – Select the Category and the Category Level from the dropdown lists
- Hide UNKNOWN DESCRIPTION – Select this to hide any data described as ‘UNKNOWN’
- Category Level Filters – Select a Level as a filter from those displayed (in this example L1/L2/L3/L4 only)
Tail Spend Analysis Example
An analysis of the Tail Spend by Supplier within a specific business category.
- Starting with the default Pareto % Limit set to 80%.
- Set the 'Change Report View’ to ‘Category’
- From either the bar chart or table on the right, select and apply a category filter (in the example shown ‘Published Products’ has been selected at Level 1)
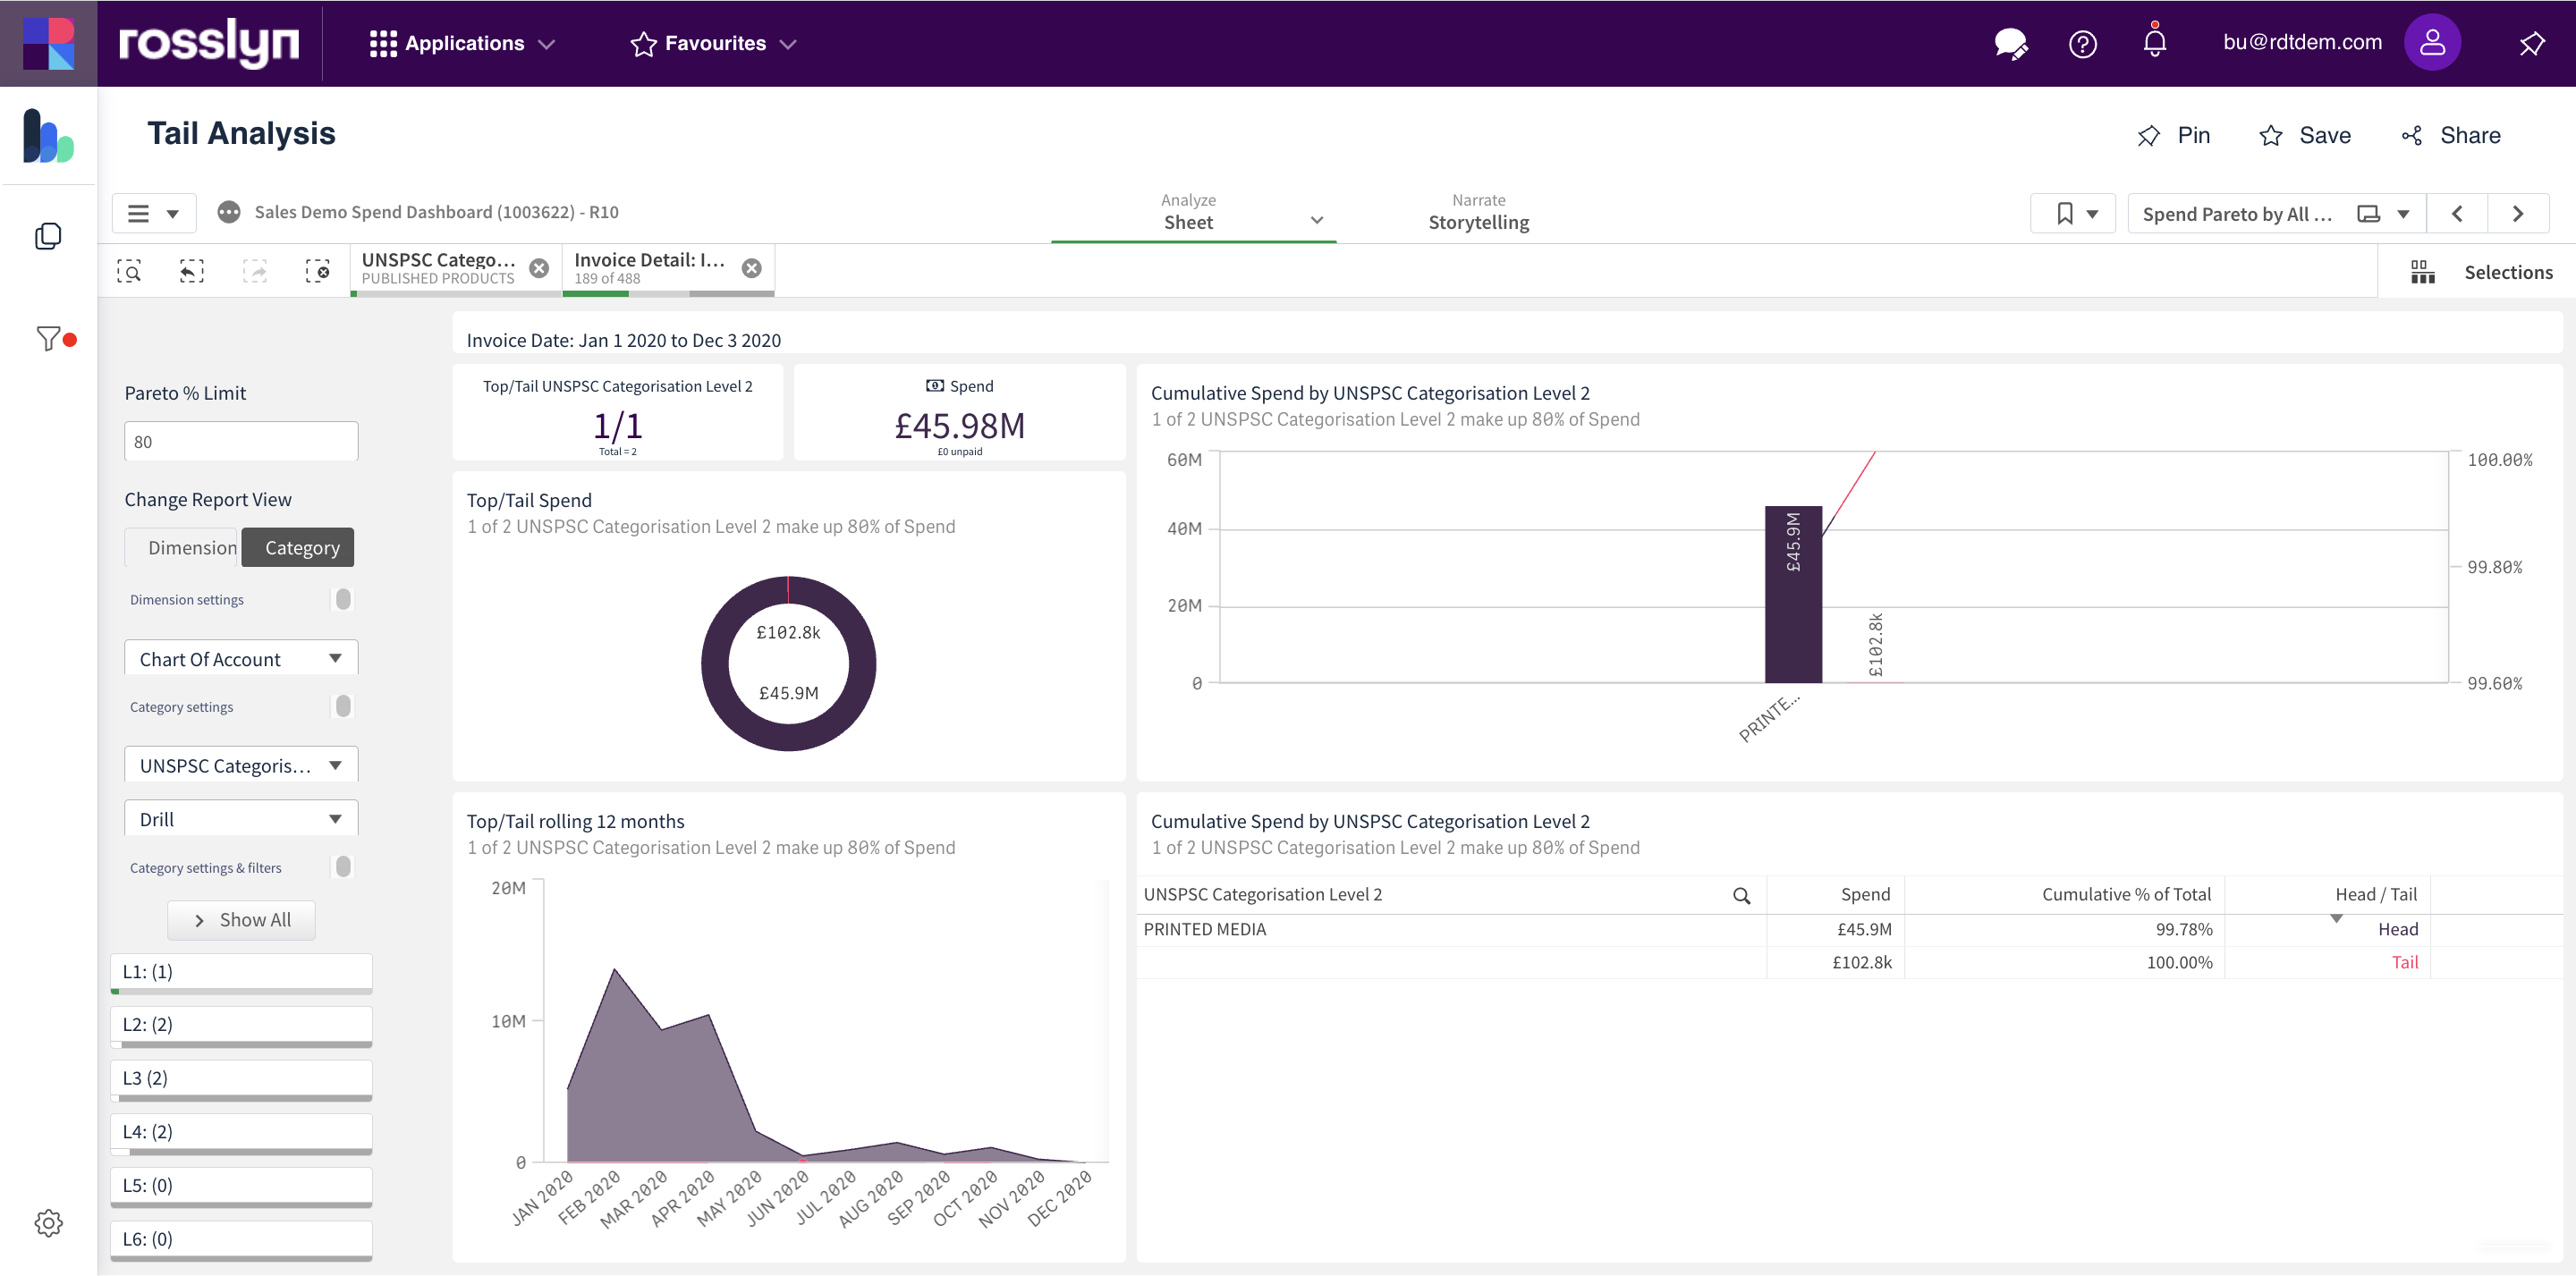
- Select 'Dimension’ in the ‘Change Report View’ section and select Supplier in the dropdown list.
- All report widgets will now focus on the Suppliers within the target Category. Specifically, the main Chart and Table report widgets
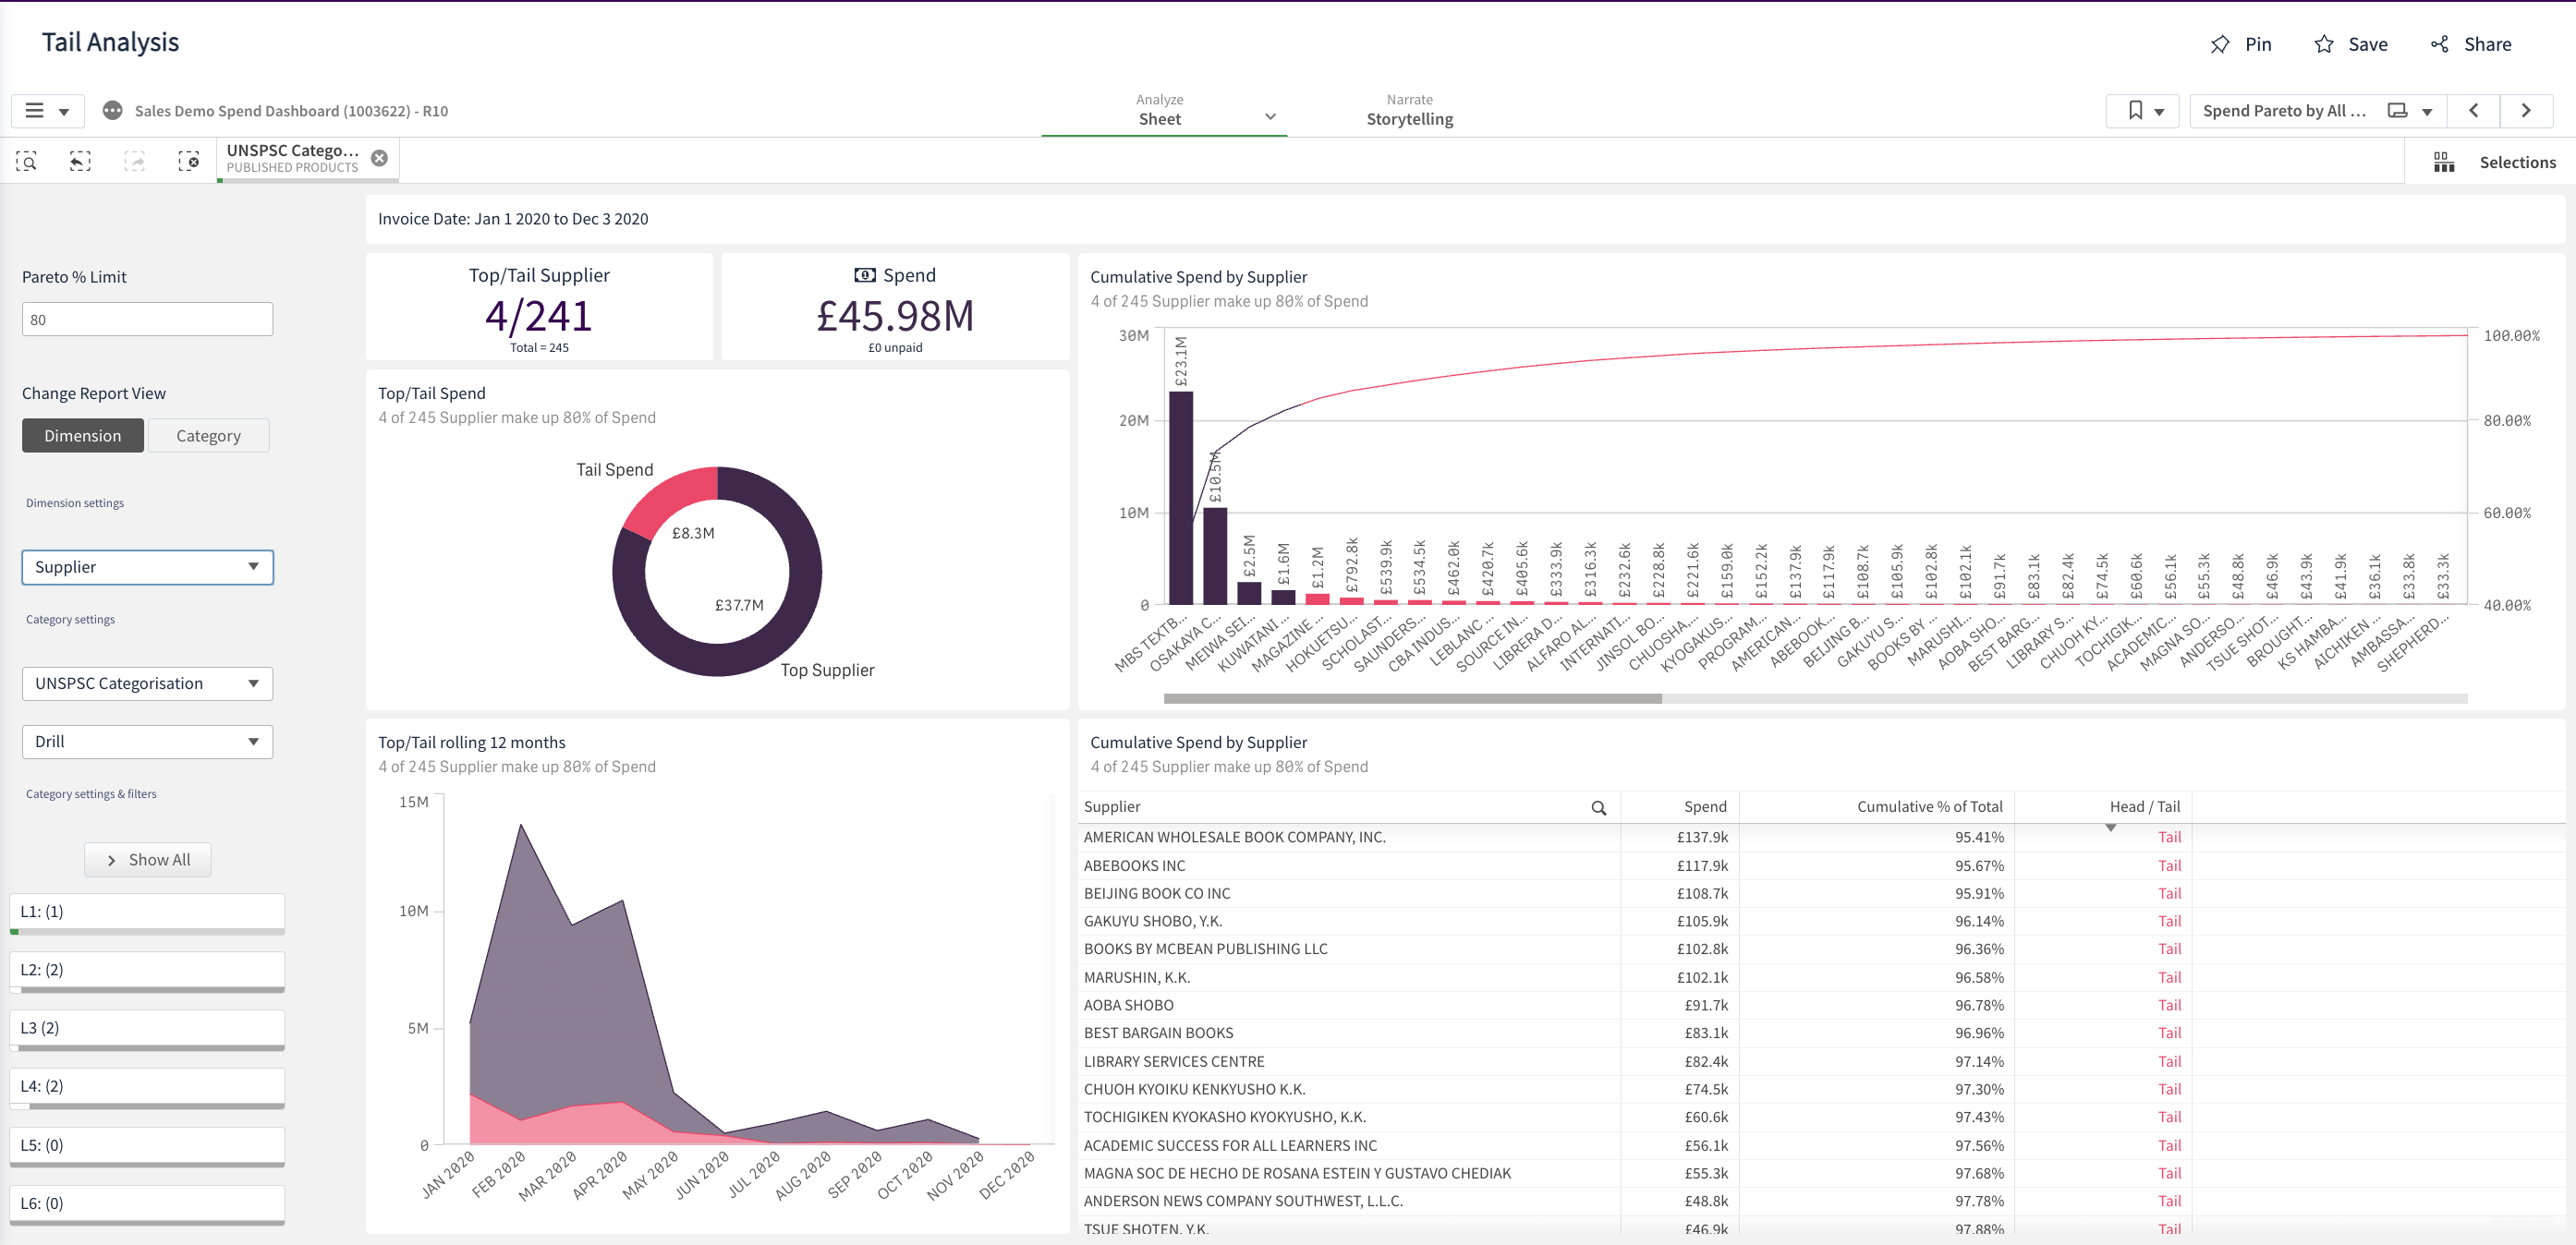
- Expand the charts to full screen if required to examine the results. Head Spend, in this example, is purple and Tail Spend is pink.
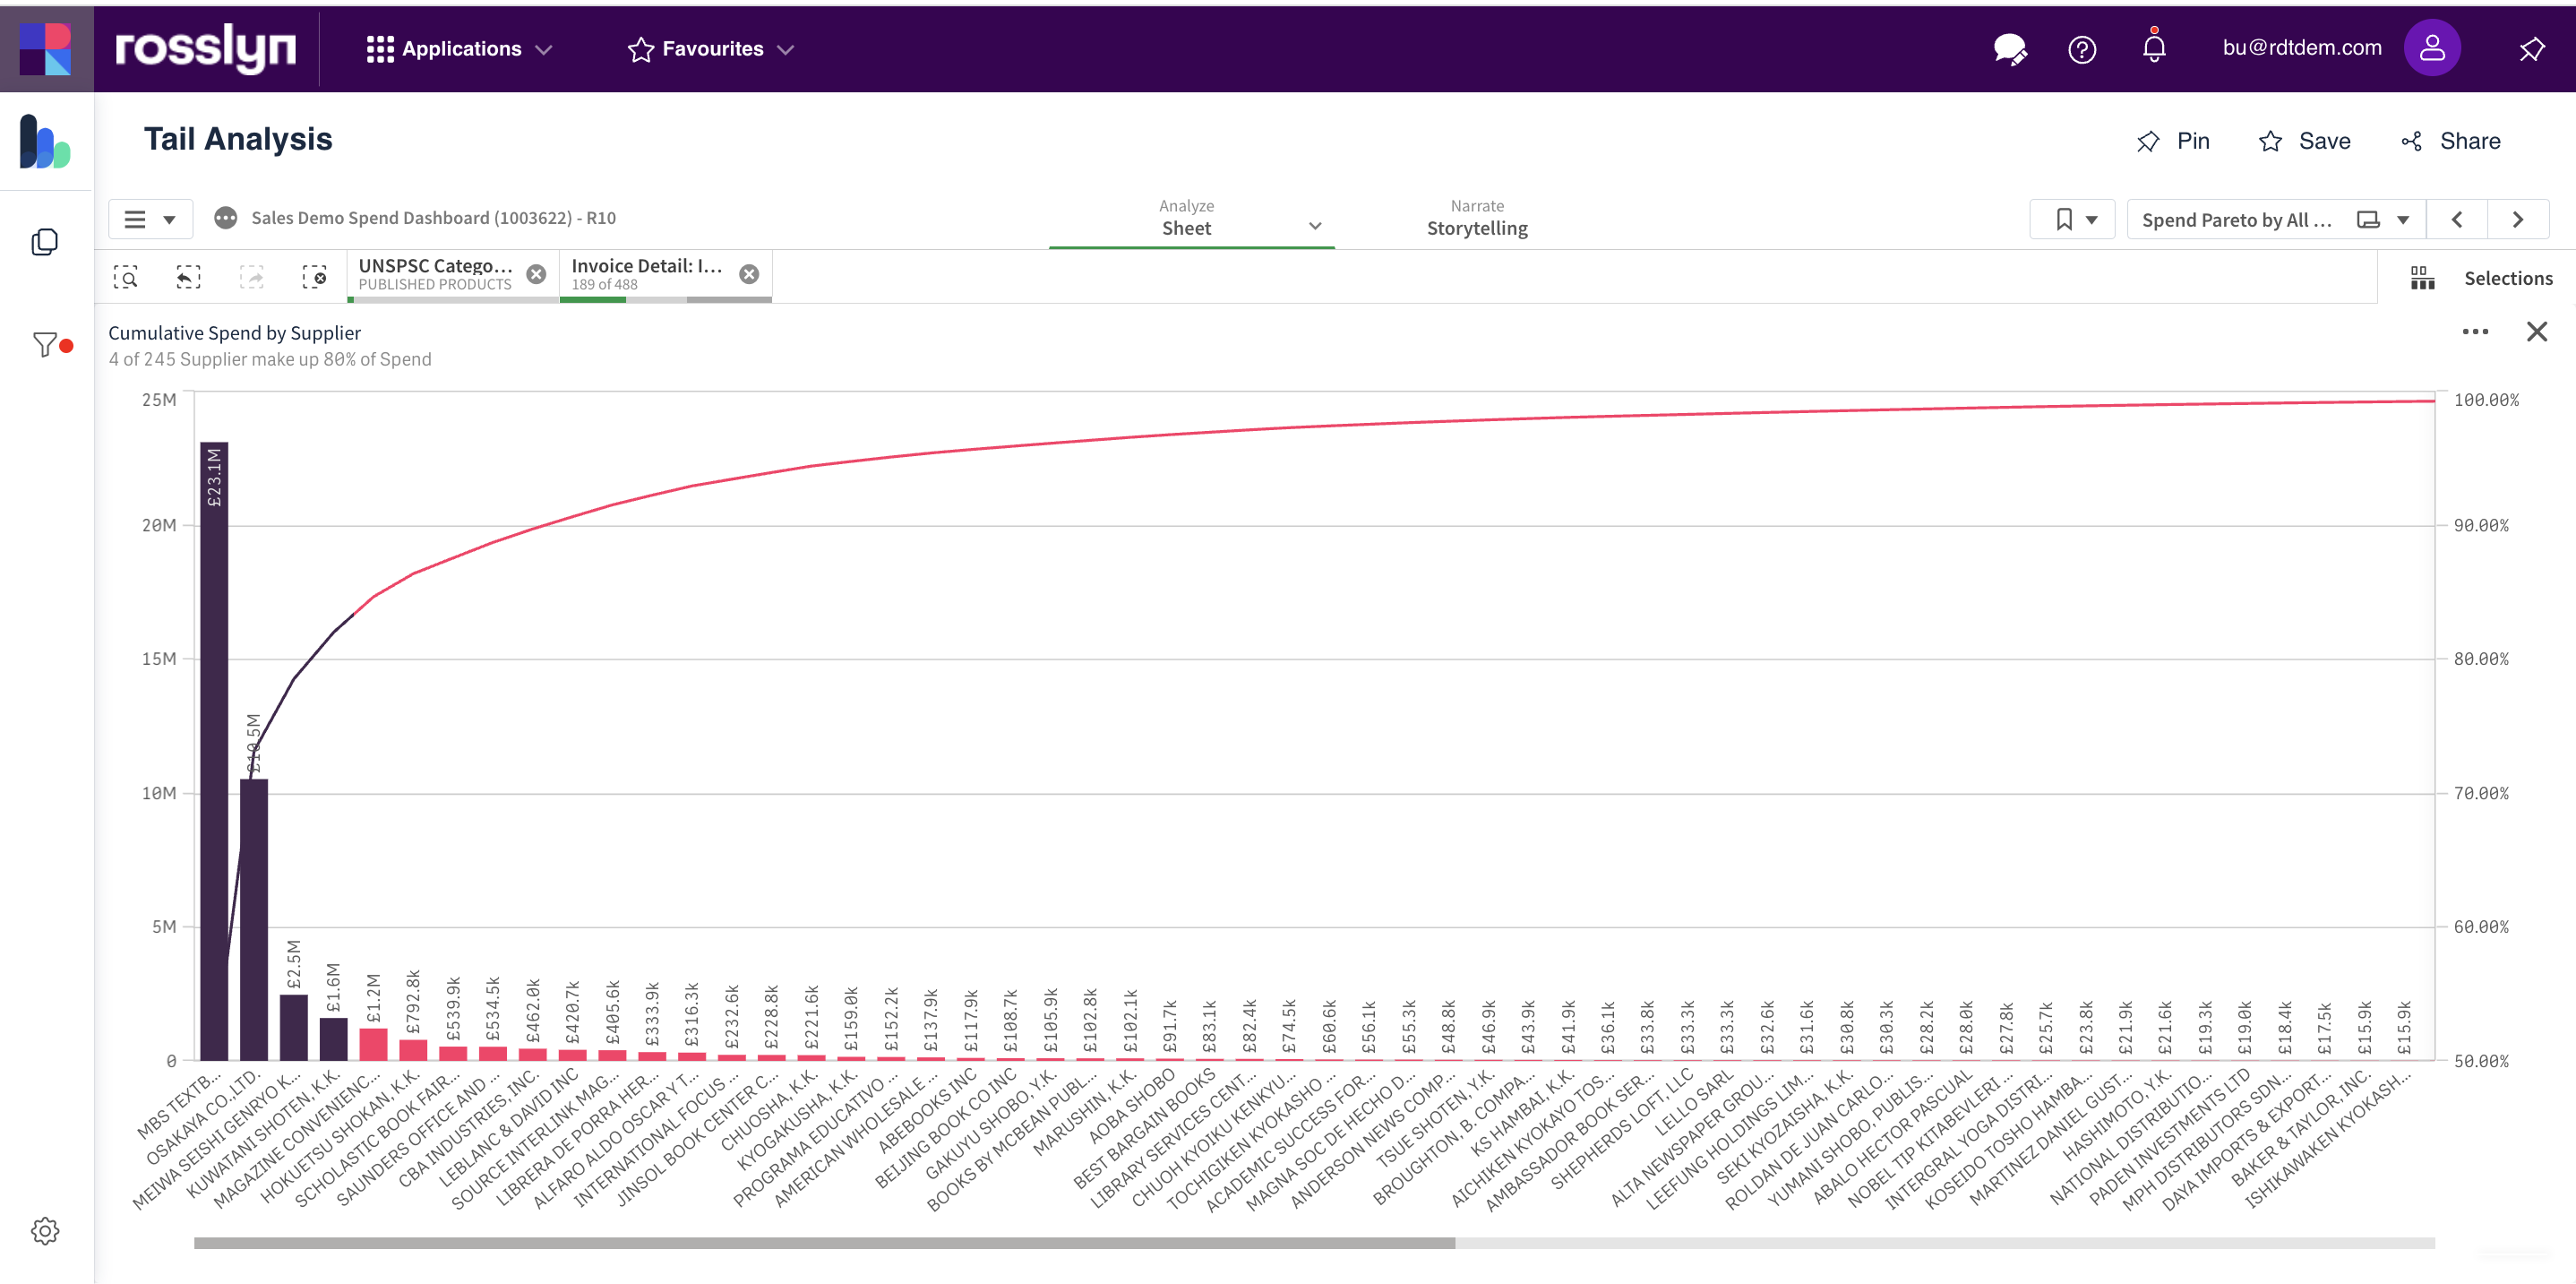
- Changing the Pareto percentage scale will allow you to change the results. Click enter or outside the ‘Pareto % Limit’ box to apply the value.