Summary Dashboards User Guide
The Summary Dashboard is split into three dashboards:
Spend: High-level key metrics based on Spend, Invoices and Suppliers.
Supplier: High-level reports focusing on Supplier-related data
Custom: Editable and customisable dashboard
In the Custom Dashboard, you can customise the layout of the dashboard screen and choose [‘Edit’] which ‘widgets’ are displayed on the screen reports.
All charts in the Summary screens are selectable and filterable. Applied filters will stay persistent across all Dashboard and Data screens.
Report Access
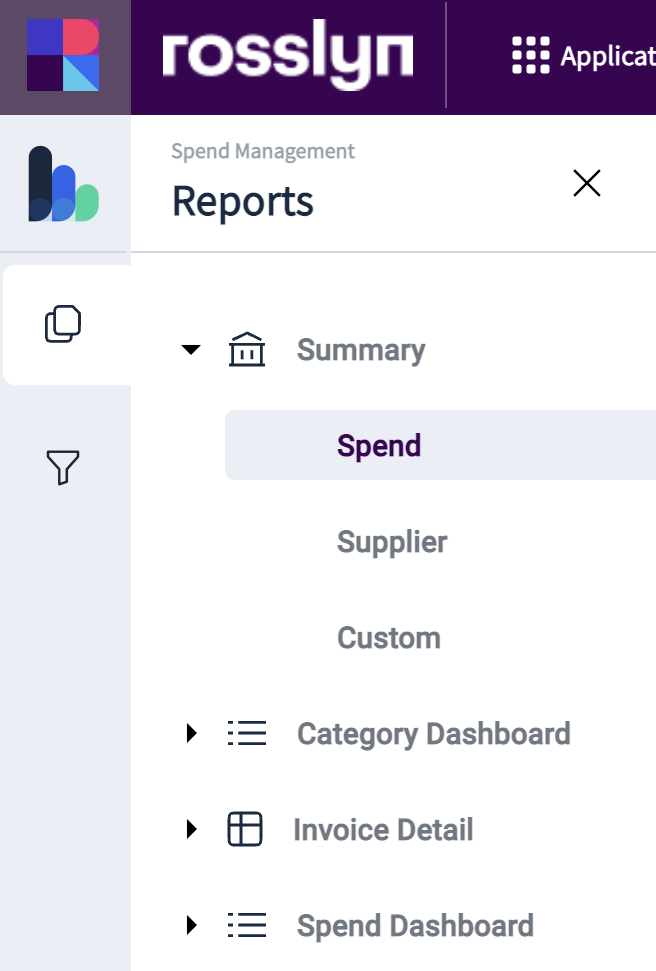
To access the Summary Dashboards and other reports within the Rosslyn Platform, use the main navigation option menu found on the left side of the screen.
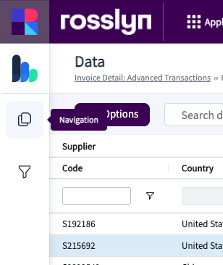
Clicking on Summary will expand the menu
Custom Dashboard
Within the Custome Dashboard, there is a ‘Customise’ button that allows you to change the display settings. There is a range of options available with icons providing an indication of each layout option.
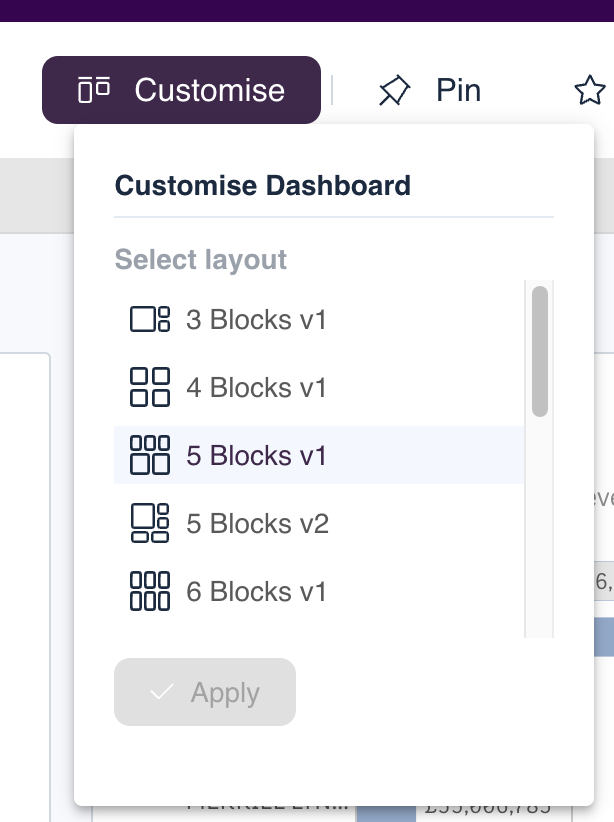
Use the scroll bar to see further options, then select and click ‘Apply’. The layout of the ‘widgets will update. You can return to this menu at any time whilst in this dashboard.
Editing a Chart within a Custom Dashboard
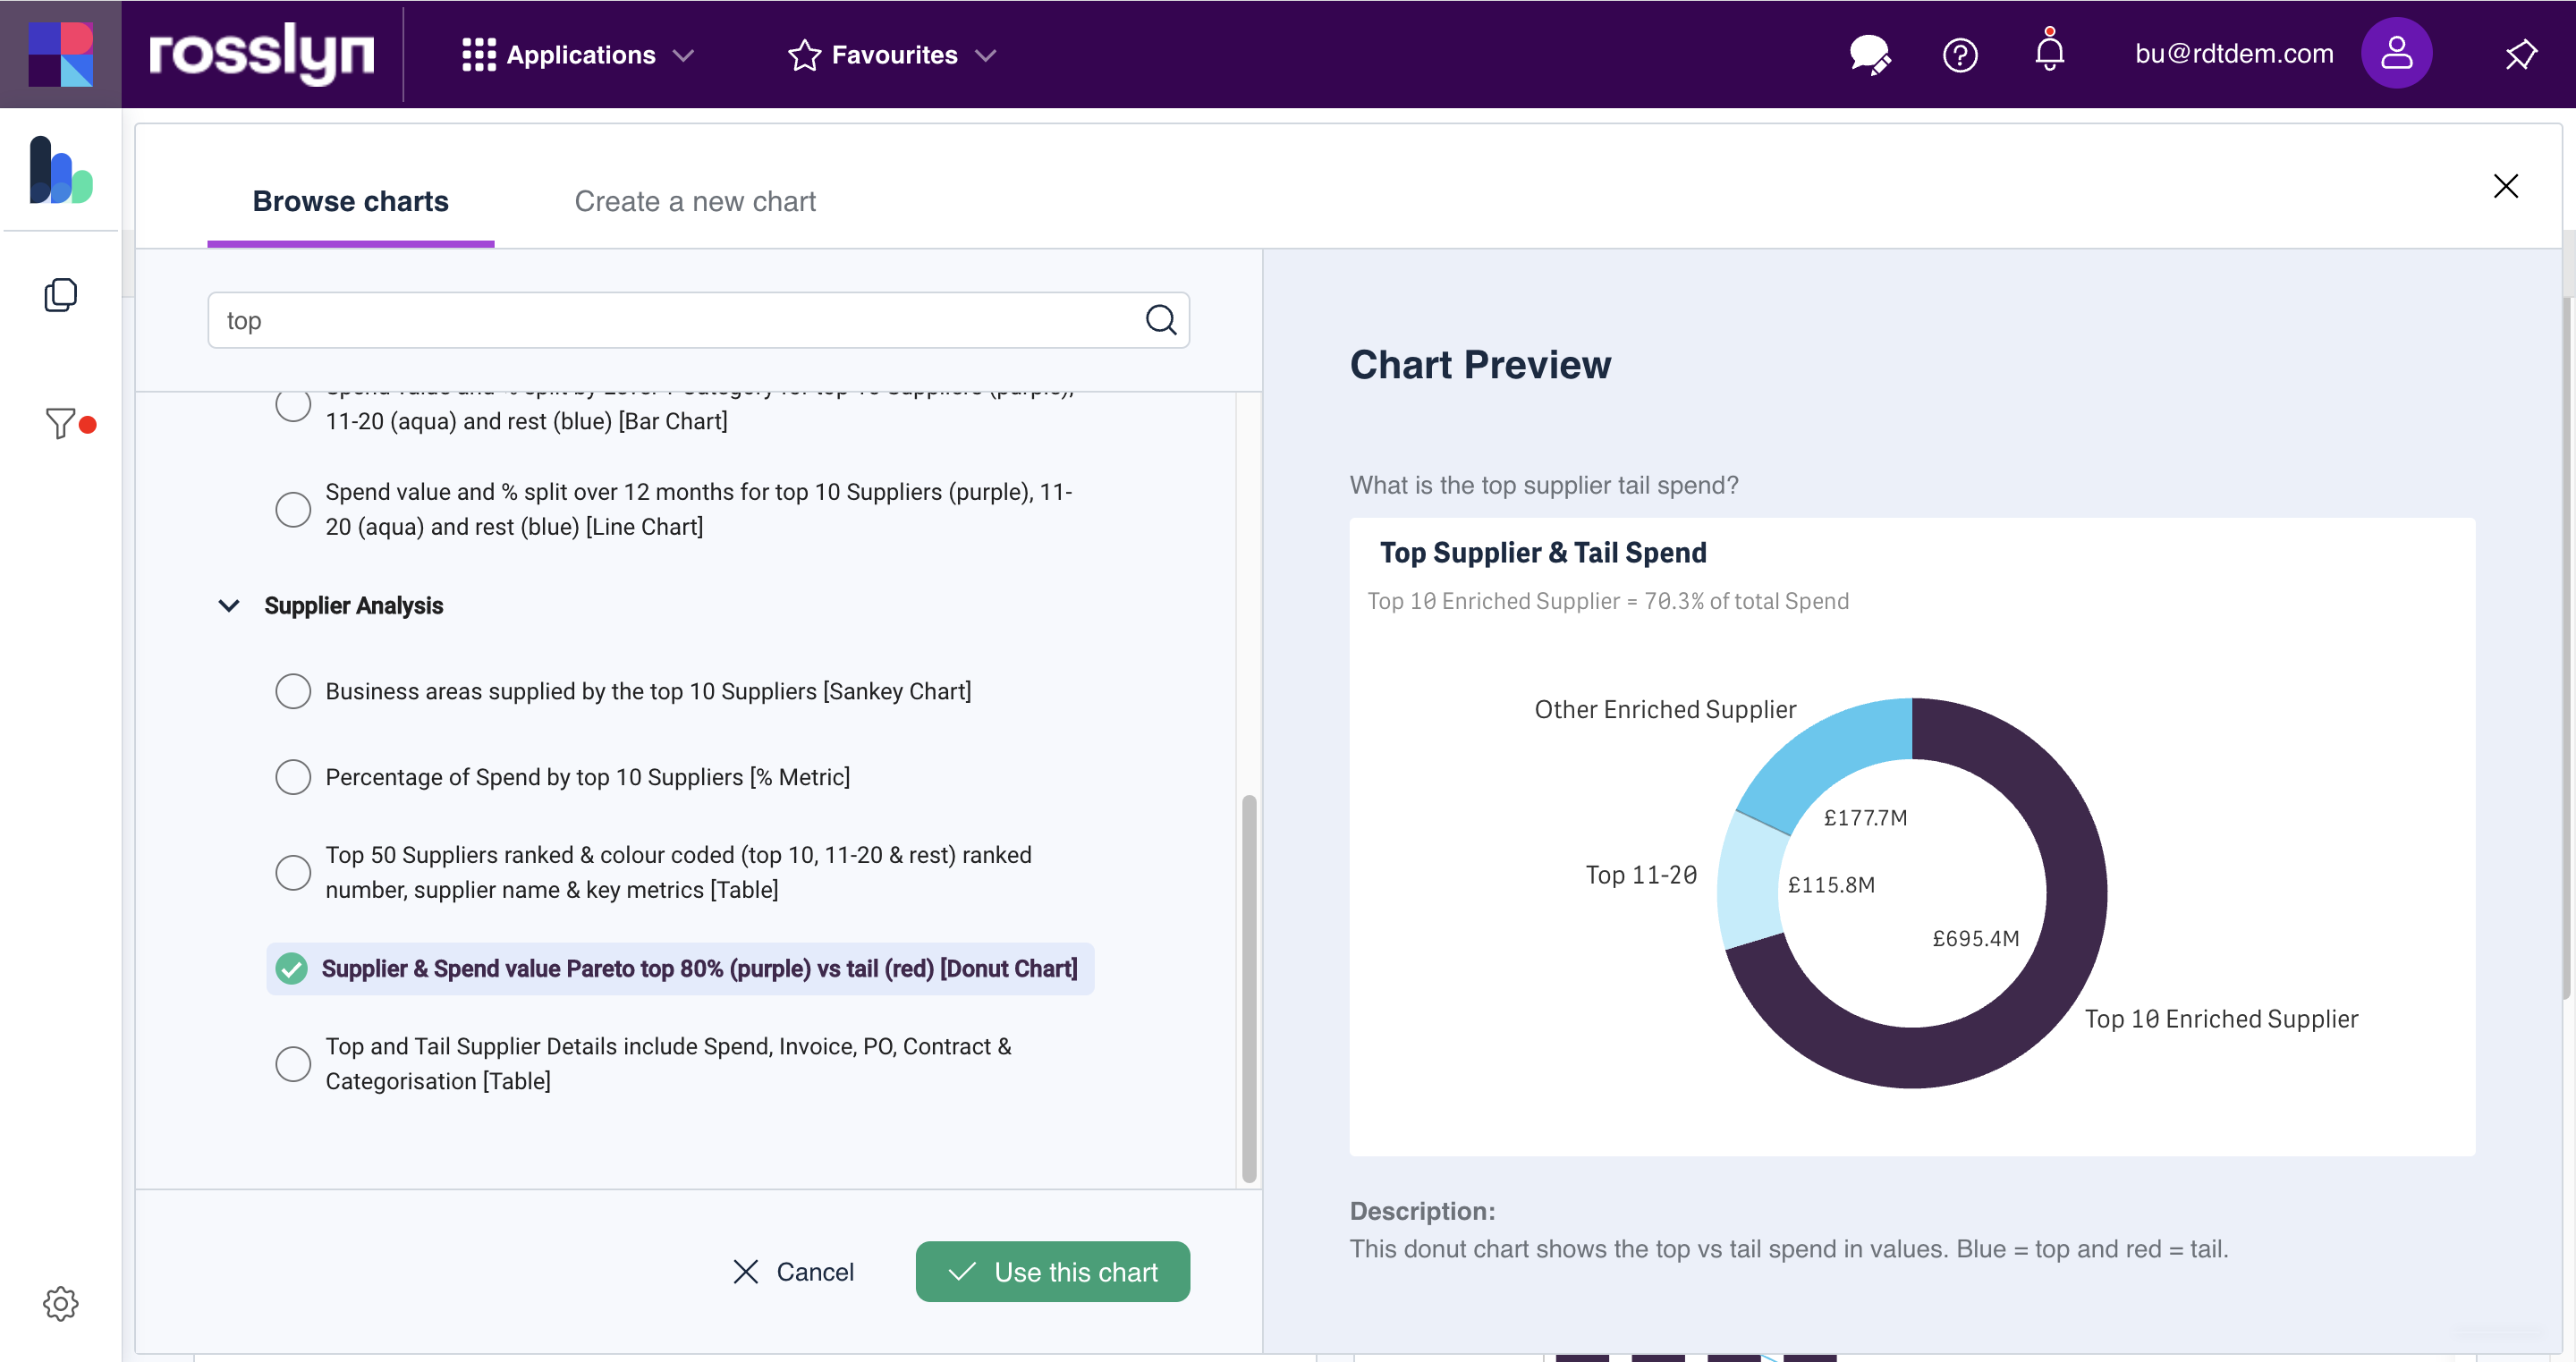
You can choose which widgets are displayed by using the ‘Edit’ option. Hoover over a ‘widget’, to display the ‘Edit’ button displays. Selecting the ‘Edit’ button will open a window where you can search for other charts.
Search and select charts in the Browse Charts section.
The ‘Customise’ and ‘Edit’ functions enable you to build custom dashboards to represent your data in the required format. These dashboards can be saved and shared with other users.
Creating a Custom Chart
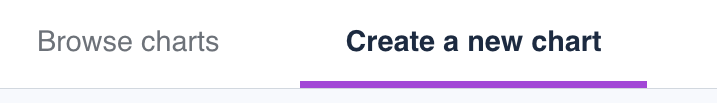
Select the Create a new chart tab.
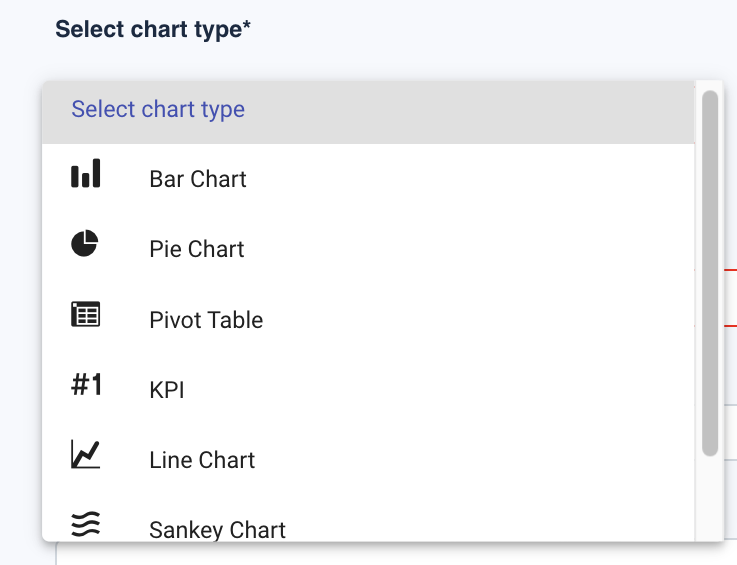
Select a chart type.
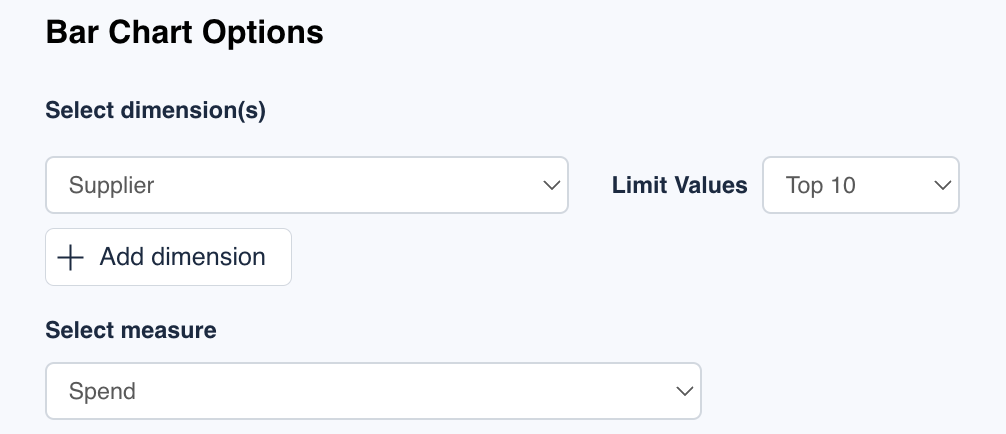
Select a dimension, Limit Value (if required) and a measure. Select additional dimensions if suitable for the chart type.
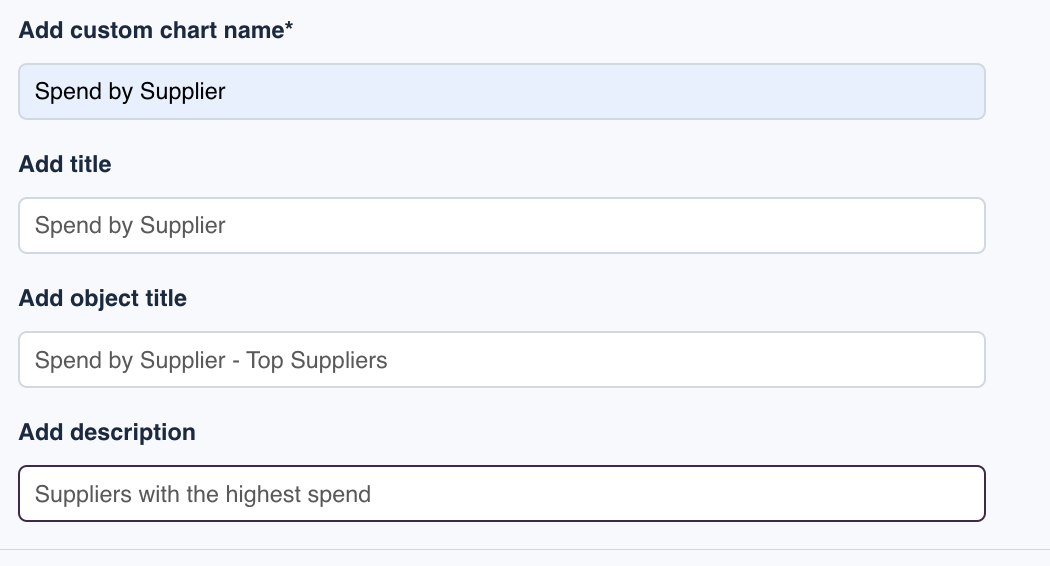
Add Chart details, which will be added to the preview on the right.
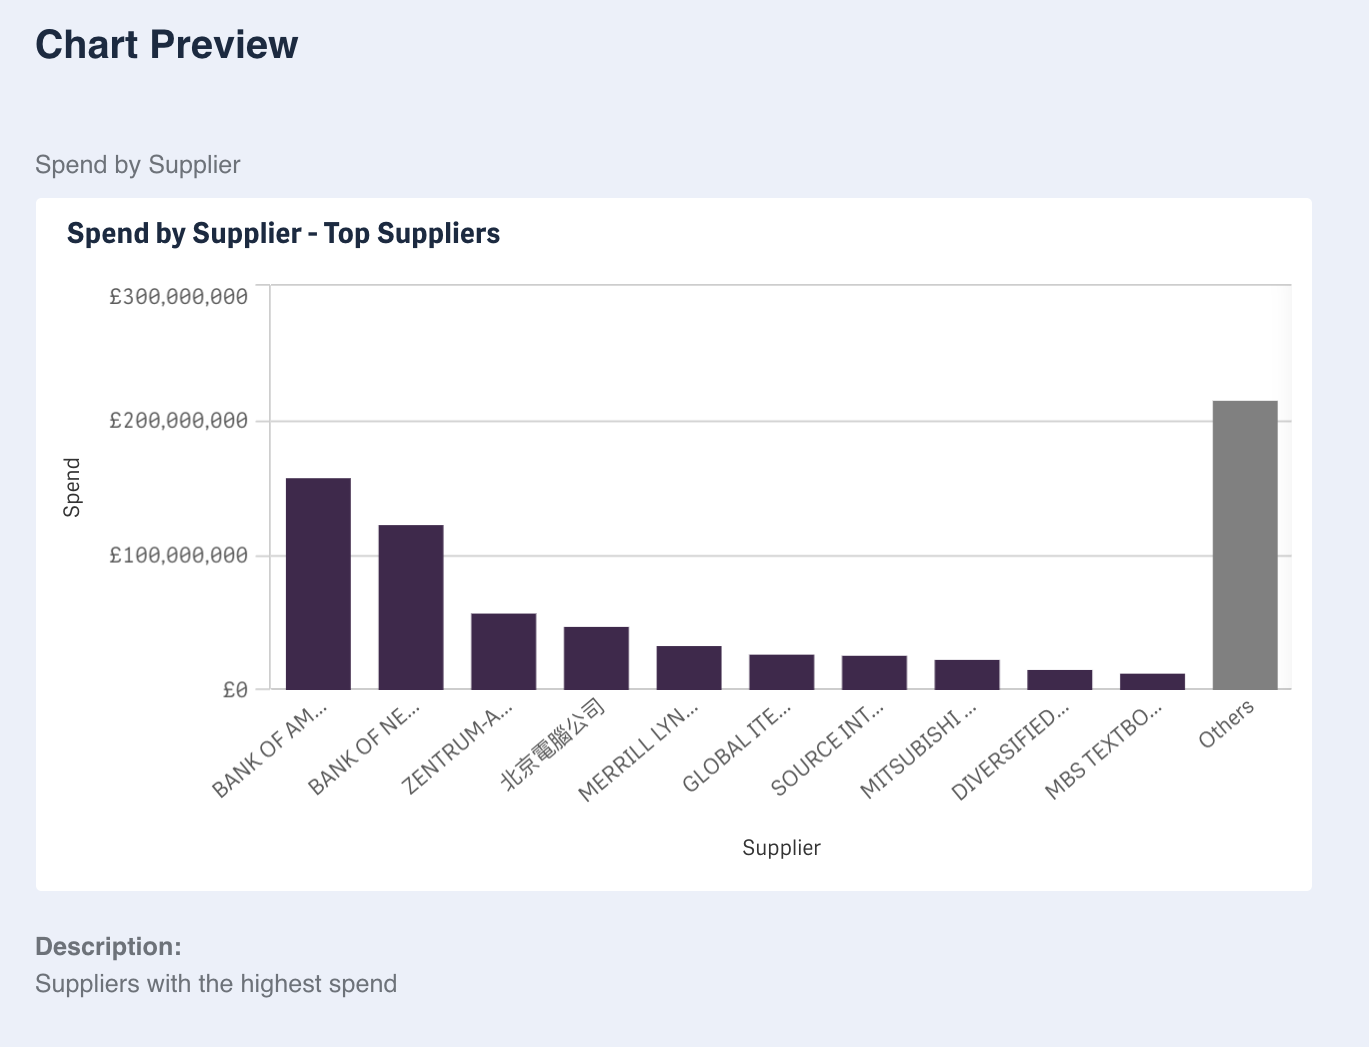
Click the button below to create the new custom chart
Saving a Dashboard
Once you have customised, filtered and/or edited your custom dashboard can be saved as a ‘Favourite’.
Click Save to open the ‘Save favourite’ window
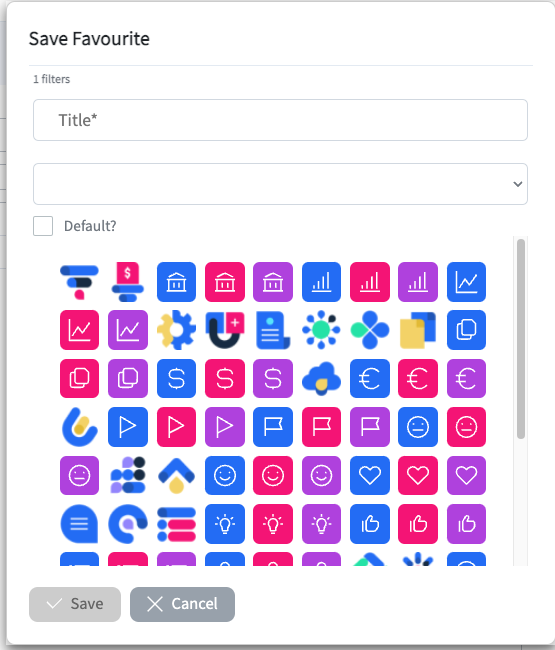
Note: A Save As option will appear if you are saving a previously saved report.
1. Give the report a title
2. Select a folder for storage within the manage favourites screen (optional)
3. Check ‘Default’ to make this your default report
4. Choose and select an icon
5. Select ‘Save’
To view a saved report, select Favourites to open the list of saved views.
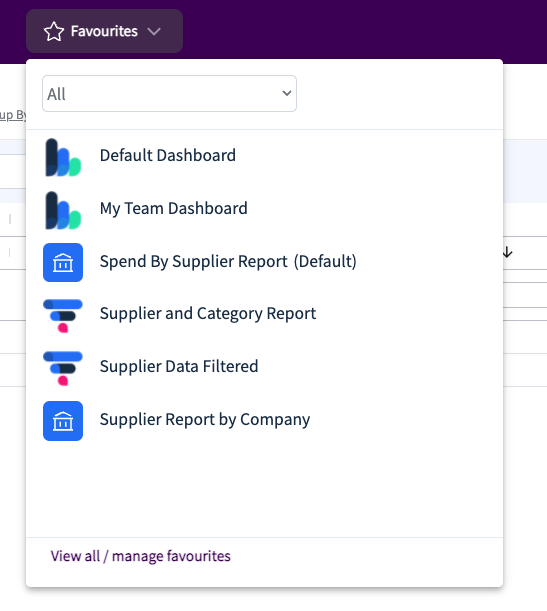
Select the required report from the list to open the report.
Sharing a dashboard
Dashboards can be shared with other Rosslyn users.
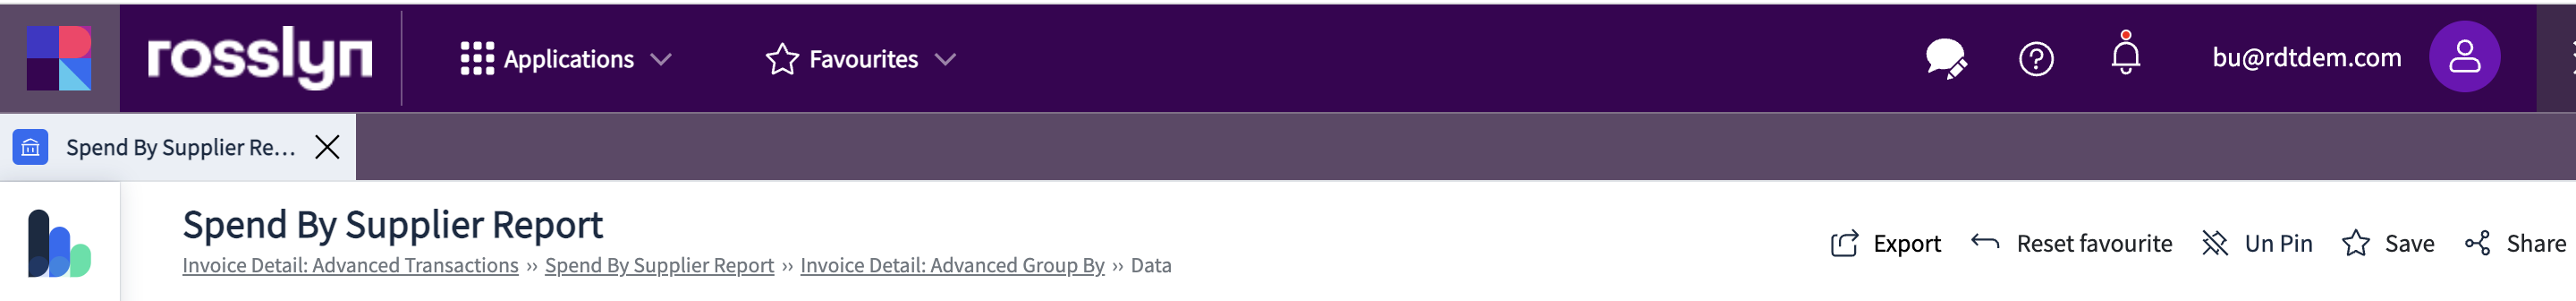
To share a report, select 'Share', located at the top right side of the screen.
This will open the ‘Share favourite’ window:
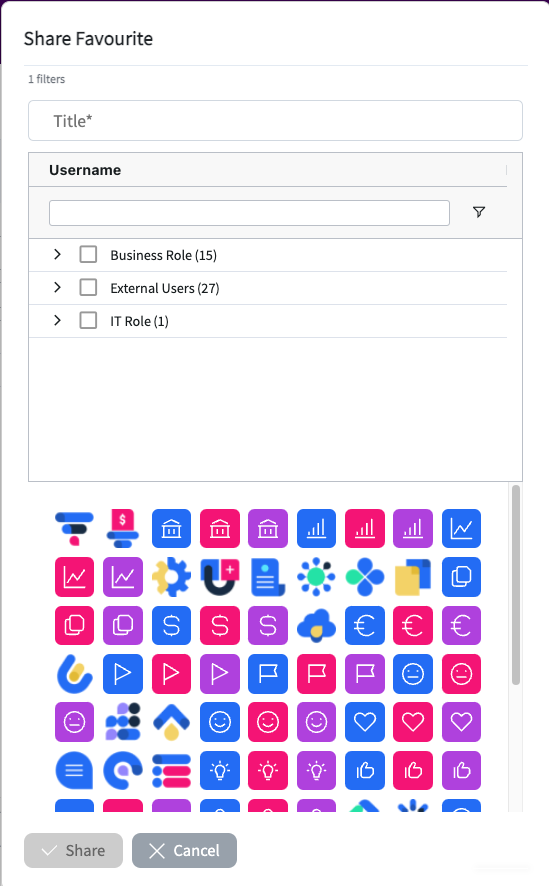
1. Give the report a title
2. Select the roles or users to share the report with.
3. Check ‘Default’ to make this your default report
4. Choose and select an icon
5. Select ‘Share’
Shared reports will appear in both the recipient's and your own favourites menu.
Pinning
Pinning allows you to pin views and quickly navigate between them. Pinned views will capture all filters, customisation and sort options applied to Dashboards or Data Reports.
Clicking on the Pin button, located on the top right side of the screen, will open a pin bar.

This feature allows you to pin various views for data comparison and contrast.
Home Button
To return to your default report from any other screen, simply click on the logo in the top left of the screen.